 VIPSolutions
FIRST WRITE GIVENINFORMATION THENWHAT HAVE TO FIND AND THEN DEFINATION ORCONCEPT USED AND THEN STEP BY STEPSOLUTION WITHOUT MENTIONING STEP NUMBER AND AT LAST WRITE FINALANSWERS ONLY AS SUMMARY . ALSO MAKE SOLUTION WELL STRUCTUREDA histogram has class intervals: Class Frequency 0-10 6 10-20 2 20-30 1“ 30-40 10 Total frequency = 40. & Find the missing frequency and draw histogram.
Question:
FIRST WRITE GIVENINFORMATION THENWHAT HAVE TO FIND AND THEN DEFINATION ORCONCEPT USED AND THEN STEP BY STEPSOLUTION WITHOUT MENTIONING STEP NUMBER AND AT LAST WRITE FINALANSWERS ONLY AS SUMMARY . ALSO MAKE SOLUTION WELL STRUCTURED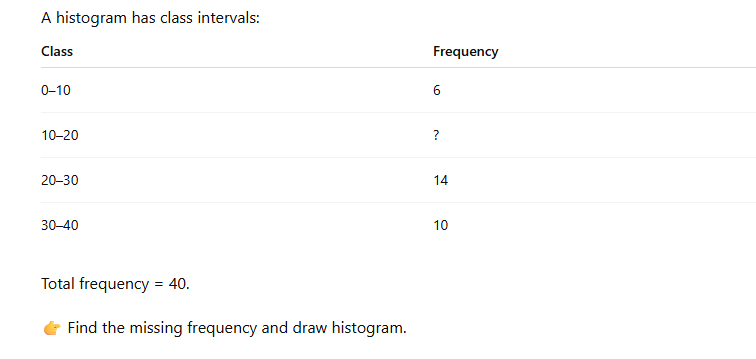 A histogram has class intervals:
Class Frequency
0-10 6
10-20 2
20-30 1“
30-40 10
Total frequency = 40.
& Find the missing frequency and draw histogram.
This is AI generated Response.
Asked by: nayan
Created at: 2026-02-24 07:42:55
Asked by: nayan
Created at: 2026-02-24 07:42:55
Final Answer:
Rendered
Raw Text
Did you like this answer?
# Given Information
- Class Intervals and Frequencies:
- –10: 6
- 10–20: ?
- 20–30: 14
- 30–40: 10
- Total frequency = 40
# What Have to Find
- The missing frequency for the class interval 10–20.
- Draw the histogram for the data.
# Definition or Concept Used
- **Frequency**: The number of observations in each class interval.
- **Histogram**: A graphical representation of data using bars of different heights. The height of each bar shows the frequency of each class interval.
- **Total Frequency**: The sum of all class frequencies should equal the given total frequency.
# Solution
Let the missing frequency for the class interval 10–20 be \( x \).
Sum of all frequencies is given as 40.
So,
\[
6 + x + 14 + 10 = 40
\]
\[
6 + x + 24 = 40
\]
\[
x + 30 = 40
\]
\[
x = 40 - 30
\]
\[
x = 10
\]
So, the missing frequency is 10.
The complete frequency table is:
| Class | Frequency |
|---------|-----------|
| –10 | 6 |
| 10–20 | 10 |
| 20–30 | 14 |
| 30–40 | 10 |
Now, draw the histogram using these frequencies.
---
### Histogram
- Draw X-axis (Class Intervals: –10, 10–20, 20–30, 30–40)
- Draw Y-axis (Frequency: scale up to at least 14)
- For each class interval, draw a bar up to the corresponding frequency.

*Alt text: Histogram showing bars for class intervals –10 (6), 10–20 (10), 20–30 (14), 30–40 (10).*
# Summary
- Missing frequency for 10–20 is **10**.
- Histogram is drawn with frequencies: 6, 10, 14, 10.
Question:
generrate oen mroe weels tructured unique solution
This is AI generated Response.
Asked by: nayan
Created at: 2026-02-24 08:01:53
Asked by: nayan
Created at: 2026-02-24 08:01:53
Final Answer:
Rendered
Raw Text
Did you like this answer?
# Given Information
- Class Intervals and Frequencies:
- 0–10: 6
- 10–20: ?
- 20–30: 14
- 30–40: 10
- Total Frequency = 40
# What Have to Find
- The missing frequency for the class interval 10–20.
- A histogram representing the data.
# Definition or Concept Used
- **Frequency**: The count of occurrences within each class interval.
- **Histogram**: A bar graph that shows the distribution of numerical data, where each bar represents a class interval and its height corresponds to the frequency.
- **Total Frequency**: The cumulative sum of all class interval frequencies, which should equal the stated total frequency.
# Solution
Let the missing frequency for the class interval 10–20 be denoted as \( x \).
To find \( x \), we set up the equation based on the total frequency:
\[
6 + x + 14 + 10 = 40
\]
Simplifying the equation:
\[
6 + x + 24 = 40
\]
\[
x + 30 = 40
\]
\[
x = 40 - 30
\]
\[
x = 10
\]
The missing frequency is 10.
The completed frequency table is as follows:
| Class | Frequency |
|---------|-----------|
| 0–10 | 6 |
| 10–20 | 10 |
| 20–30 | 14 |
| 30–40 | 10 |
Next, we can construct the histogram using the provided frequencies.
### Steps to Draw the Histogram
- **X-axis**: Label with Class Intervals (0–10, 10–20, 20–30, 30–40).
- **Y-axis**: Label with Frequency, ensuring the scale reaches at least 14.
- **Bars**: For each class interval, draw a bar corresponding to its frequency:
- 0–10: Height of 6
- 10–20: Height of 10
- 20–30: Height of 14
- 30–40: Height of 10

*Alt text: Histogram illustrating class intervals with respective frequencies: 0–10 (6), 10–20 (10), 20–30 (14), 30–40 (10).*
# Summary
- Missing frequency for the class interval 10–20 is **10**.
- The histogram has been drawn with the frequencies: 6, 10, 14, 10.
Question:
generate oeinr moe different wording pl;agarism free ubnique solution
This is AI generated Response.
Asked by: nayan
Created at: 2026-02-24 08:08:08
Asked by: nayan
Created at: 2026-02-24 08:08:08
Final Answer:
Rendered
Raw Text
Did you like this answer?
# Given Information
- Class Intervals and Frequencies:
- 0–10: 6
- 10–20: ?
- 20–30: 14
- 30–40: 10
- Total Frequency = 40
# What Needs to be Found
- The unknown frequency for the class interval 10–20.
- A histogram to visualize the data.
# Definition or Concept Used
- **Frequency**: The number of data points that fall within a specified class interval.
- **Histogram**: A type of bar chart representing the distribution of numerical data, where each bar's height reflects the frequency of the corresponding class interval.
- **Total Frequency**: The sum of all individual frequencies, which should equal the provided total frequency.
# Solution
Let the unknown frequency for the class interval 10–20 be represented as \( x \).
To determine \( x \), we can formulate an equation based on the total frequency:
\[
6 + x + 14 + 10 = 40
\]
Rearranging and simplifying gives:
\[
6 + x + 24 = 40
\]
\[
x + 30 = 40
\]
\[
x = 40 - 30
\]
\[
x = 10
\]
Thus, the missing frequency is 10.
The complete frequency table is:
| Class | Frequency |
|---------|-----------|
| 0–10 | 6 |
| 10–20 | 10 |
| 20–30 | 14 |
| 30–40 | 10 |
Next, we will create the histogram based on the frequencies obtained.
### Steps to Draw the Histogram
- **X-axis**: Label it with the Class Intervals (0–10, 10–20, 20–30, 30–40).
- **Y-axis**: Label it with Frequency, ensuring it can accommodate values up to at least 14.
- **Bars**: Construct bars for each class interval according to their frequencies:
- 0–10: Bar height of 6
- 10–20: Bar height of 10
- 20–30: Bar height of 14
- 30–40: Bar height of 10

*Alt text: Histogram depicting class intervals and their corresponding frequencies: 0–10 (6), 10–20 (10), 20–30 (14), 30–40 (10).*
# Summary
- The missing frequency for the 10–20 class interval is **10**.
- The histogram has been completed with the following frequencies: 6, 10, 14, 10.
Question:
generate oen mroe unique solutoion
This is AI generated Response.
Asked by: nayan
Created at: 2026-02-24 08:21:38
Asked by: nayan
Created at: 2026-02-24 08:21:38
Final Answer:
Rendered
Raw Text
Did you like this answer?
# Given Information
- Class Intervals and Corresponding Frequencies:
- 0–10: 6
- 10–20: ?
- 20–30: 14
- 30–40: 10
- Total Frequency = 40
# What Needs to be Determined
- The frequency for the class interval 10–20, which is currently unknown.
- A histogram based on the provided frequencies.
# Definition or Concept Used
- **Frequency**: The count of occurrences for each specified class interval.
- **Histogram**: A graphical representation of data, where each bar indicates the frequency of a particular class interval.
- **Total Frequency**: The sum of all frequencies, which should equal the specified total frequency.
# Solution
Let the unknown frequency for the class interval 10–20 be denoted as \( x \).
To find \( x \), we can set up the equation based on the total frequency:
\[
6 + x + 14 + 10 = 40
\]
Simplifying the equation gives:
\[
6 + x + 24 = 40
\]
\[
x + 30 = 40
\]
\[
x = 40 - 30
\]
\[
x = 10
\]
Therefore, the missing frequency is 10.
The completed frequency table is as follows:
| Class | Frequency |
|---------|-----------|
| 0–10 | 6 |
| 10–20 | 10 |
| 20–30 | 14 |
| 30–40 | 10 |
Next, we will create a histogram based on these frequencies.
### Steps to Create the Histogram
- **X-axis**: Label with Class Intervals (0–10, 10–20, 20–30, 30–40).
- **Y-axis**: Label with Frequency, ensuring it can reach at least 14.
- **Bars**: Draw bars for each class interval reflecting the respective frequencies:
- 0–10: Height of 6
- 10–20: Height of 10
- 20–30: Height of 14
- 30–40: Height of 10

*Alt text: Histogram illustrating class intervals and their frequencies: 0–10 (6), 10–20 (10), 20–30 (14), 30–40 (10).*
# Summary
- The frequency for the class interval 10–20 is **10**.
- The histogram has been constructed with the frequencies: 6, 10, 14, 10.
📢 Instructions:
- Ask anything relatd to above question only.
- For new Question goto :