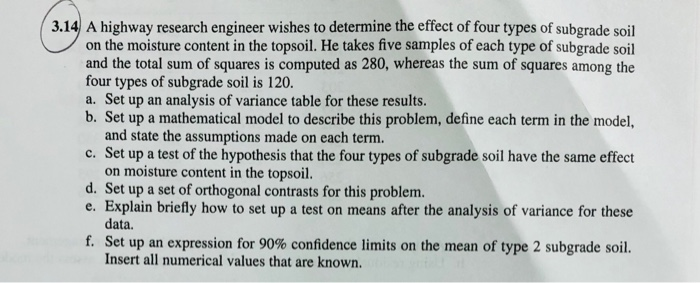
Act like a helpful tutor and exlain me :(314 A highway research engineer wishes to determine the effect of four types of subgrade soil
\_ on the moisture content in the topsoil. He takes five samples of each type of subgrade soil
and the total sum of squares is computed as 280, whereas the sum of squares among the
four types of subgrade soil is 120.
a. Set up an analysis of variance table for these results.
b. Set up a mathematical model to describe this problem, define each term in the model,
and state the assumptions made on each term.
¢. Setup a test of the hypothesis that the four types of subgrade soil have the same effect
on moisture content in the topsoil.
d. Setup a set of orthogonal contrasts for this problem.
e. Explain briefly how 10 set up a test on means after the analysis of variance for these
data.
£. Set up an expression for 90% confidence limits on the mean of type 2 subgrade soil.
Insert all numerical values that are known,
Question:
Act like a helpful tutor and exlain me :(314 A highway research engineer wishes to determine the effect of four types of subgrade soil
\_ on the moisture content in the topsoil. He takes five samples of each type of subgrade soil
and the total sum of squares is computed as 280, whereas the sum of squares among the
four types of subgrade soil is 120.
a. Set up an analysis of variance table for these results.
b. Set up a mathematical model to describe this problem, define each term in the model,
and state the assumptions made on each term.
¢. Setup a test of the hypothesis that the four types of subgrade soil have the same effect
on moisture content in the topsoil.
d. Setup a set of orthogonal contrasts for this problem.
e. Explain briefly how 10 set up a test on means after the analysis of variance for these
data.
£. Set up an expression for 90% confidence limits on the mean of type 2 subgrade soil.
Insert all numerical values that are known,
This is AI generated Response.
Asked by: Umesh
Created at: 2025-08-04 00:09:48
Final Answer:
RenderedRaw Text
Did you like this answer?
Absolutely! Let's go step by step through question 3.14, which deals with **ANOVA (Analysis of Variance)** for testing the effect of subgrade soil types on topsoil moisture content.
---
### **Given Data:**
- 4 types of subgrade soil
- 5 samples for each type (so, total samples = 4 × 5 = 20)
- Total Sum of Squares (SST) = 280
- Sum of Squares Among types (SSA) = 120
---
### **a. Set up an analysis of variance table for these results.**
The typical ANOVA table:
| Source | Degrees of Freedom | Sum of Squares | Mean Square | F-ratio |
|-------------|-------------------|----------------|-------------|----------|
| Between Groups (SSA) | k-1 | SSA | SSA/(k-1) | MS(A)/MS(E) |
| Within Groups (SSE) | N-k | SSE | SSE/(N-k) | |
| Total | N-1 | SST | | |
Where:
- \( k \) = number of groups = **4**
- \( n \) = samples per group = **5**
- \( N \) = total samples = **20**
- \( SST \) = total sum of squares = **280**
- \( SSA \) = sum of squares among = **120**
- \( SSE \) = sum of squares error = \( SST - SSA = 280 - 120 = 160 \)
**Degrees of Freedom:**
- Between: \( k-1 = 3 \)
- Within: \( N-k = 16 \)
- Total: \( N-1 = 19 \)
**Mean Squares:**
- Between: \( MS_A = SSA/(k-1) = 120/3 = 40 \)
- Within: \( MS_E = SSE/(N-k) = 160/16 = 10 \)
**F-ratio:** \( F = MS_A / MS_E = 40/10 = 4 \)
So, the table:
| Source | df | SS | MS | F |
|------------------|-----|------|------|--------|
| Among (Between) | 3 | 120 | 40 | 4 |
| Error (Within) | 16 | 160 | 10 | |
| Total | 19 | 280 | | |
---
### **b. Set up a mathematical model**
This is a **one-way ANOVA model**:
\[
Y_{ij} = \mu + \tau_i + \epsilon_{ij}
\]
Where:
- \( Y_{ij} \): moisture content for the j-th sample of the i-th soil type
- \( \mu \): overall mean
- \( \tau_i \): effect of the i-th soil type (\( i = 1,2,3,4 \))
- \( \epsilon_{ij} \): random error (assumed i.i.d. normal, mean 0, variance \(\sigma^2\))
**Assumptions:**
- Errors (\( \epsilon_{ij} \)) are independent and normally distributed with mean 0 and constant variance.
- The samples are randomly selected.
- The effects (\( \tau_i \)) are fixed.
---
### **c. Set up a test of the hypothesis that the four types of subgrade soil have the same effect**
**Null Hypothesis (\( H_0 \)):**
\[
\tau_1 = \tau_2 = \tau_3 = \tau_4 = 0
\]
(So, all means equal: \( \mu_1 = \mu_2 = \mu_3 = \mu_4 \))
**Alternative Hypothesis (\( H_A \)):**
At least one \( \tau_i \neq 0 \) (at least one mean is different).
Use the F-test from the ANOVA table:
\[
F = \frac{MS_A}{MS_E}
\]
Compare computed F (here, 4) to the critical value \( F_{3,16,\alpha} \) from F-tables (with 3 and 16 df).
---
### **d. Set up a set of orthogonal contrasts for this problem**
- With 4 groups, you can have 3 independent (orthogonal) contrasts.
One possible set (assuming groups are 1,2,3,4):
1. Compare group 1 vs others:
\[
C_1: \frac{3}{4}\mu_1 - \frac{1}{4}(\mu_2+\mu_3+\mu_4)
\]
2. Compare group 2 vs 3,4:
\[
C_2: \frac{1}{2}\mu_2 - \frac{1}{4}(\mu_3+\mu_4)
\]
3. Compare group 3 vs 4:
\[
C_3: \frac{1}{2}\mu_3 - \frac{1}{2}\mu_4
\]
Make sure coefficients sum to zero and contrasts are orthogonal (dot products = 0).
---
### **e. Explain briefly how to set up a test on means after the ANOVA**
If ANOVA is significant (rejects \( H_0 \)), use **multiple comparison procedures** (like Tukey's, Bonferroni, LSD, etc.) to test which means differ:
- Compute the difference between group means.
- Calculate standard error for the difference (using \( MS_E \)).
- Use the appropriate critical value (from t or q tables) to determine if the difference is significant.
---
### **f. Set up an expression for 90% confidence limits on the mean of type 2 subgrade soil**
The confidence interval for the mean of group 2:
\[
\bar{Y}_{2\cdot} \pm t_{0.05,16} \times \sqrt{\frac{MS_E}{n}}
\]
Where:
- \( \bar{Y}_{2\cdot} \): sample mean for type 2
- \( t_{0.05,16} \): t-value for 90% CI, 16 df (from t-table; approx 1.746)
- \( MS_E = 10 \)
- \( n = 5 \)
So,
\[
\bar{Y}_{2\cdot} \pm 1.746 \times \sqrt{\frac{10}{5}}
= \bar{Y}_{2\cdot} \pm 1.746 \times \sqrt{2}
= \bar{Y}_{2\cdot} \pm 1.746 \times 1.414
= \bar{Y}_{2\cdot} \pm 2.47
\]
---
**If you need a deeper explanation or examples for any part, let me know!**
Question:
final answers in 5 lines only
This is AI generated Response.
Asked by: Umesh
Created at: 2025-08-04 01:40:49
Final Answer:
RenderedRaw Text
Did you like this answer?
Certainly! Here's a concise summary:
1. ANOVA table: df=3,16; SSA=120, SSE=160, MS_A=40, MS_E=10, F=4.
2. Model: \(Y_{ij} = \mu + \tau_i + \epsilon_{ij}\), with errors normal, independent, equal variance.
3. Test \(H_0: \tau_1=\tau_2=\tau_3=\tau_4=0\) using F=4; compare to critical F.
4. Orthogonal contrasts: e.g., group 1 vs. others, group 2 vs. 3 & 4, group 3 vs. 4.
5. 90% CI for type 2 mean: \(\bar{Y}_2 \pm 1.746 \times \sqrt{10/5} \approx \bar{Y}_2 \pm 2.47\).
VIPSolutions focuses on clear, step‑by‑step explanations so you can learn quickly. Whether you need an AI‑generated walkthrough or a short hint to get unstuck, each solution is organized for fast reading and easy review later.
Search similar questions, compare approaches, and bookmark the best answers for revision. Our goal is simple: quick, reliable study help that feels natural—not noisy.
 VIPSolutions
 (314 A highway research engineer wishes to determine the effect of four types of subgrade soil
\_ on the moisture content in the topsoil. He takes five samples of each type of subgrade soil
and the total sum of squares is computed as 280, whereas the sum of squares among the
four types of subgrade soil is 120.
a. Set up an analysis of variance table for these results.
b. Set up a mathematical model to describe this problem, define each term in the model,
and state the assumptions made on each term.
¢. Setup a test of the hypothesis that the four types of subgrade soil have the same effect
on moisture content in the topsoil.
d. Setup a set of orthogonal contrasts for this problem.
e. Explain briefly how 10 set up a test on means after the analysis of variance for these
data.
£. Set up an expression for 90% confidence limits on the mean of type 2 subgrade soil.
Insert all numerical values that are known,