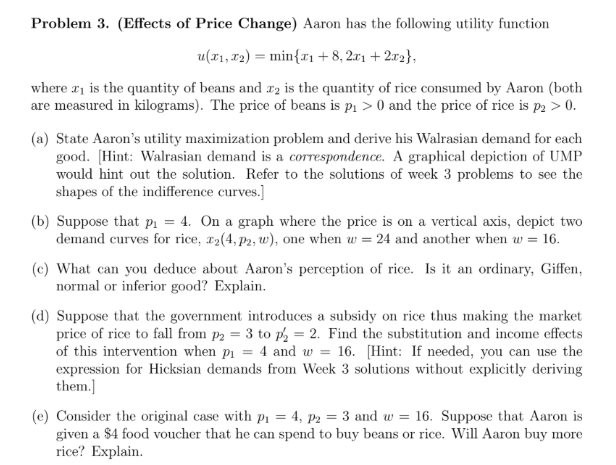
Give step-by-step solution with explanation and final answer:Problem 3. (Effects of Price Change) Aaron has the following utility function
u(r, 72) = min{z: + 8,201 + 202),
where 2, is the quantity of beans and is the quantity of rice consumed by Aaron (hoth
are measured in kilograms). The price of beans is py > 0 and the price of rice is p; > 0.
(a) State Aaron’s utility maximization problem and derive his Walrasian demand for each
good. [Hint: Walrasian demand is a correspondence. A graphical depiction of UMP
would hint out the solution. Refer to the solutions of week 3 problems to see the
shapes of the indifference curves.)
(b) Suppose that p, = 4. On a graph where the price is on a vertical axis, depict two
demand curves for rice, 25(4, pa, w), one when w = 24 and another when w = 16.
(¢) What can you deduce about Aaron's perception of rice. Is it an ordinary, Giffen.
normal or inferior good? Explain.
(d) Suppose that the government introduces a subsidy on rice thus making the market
price of rice to fall from p; = 3 to p= 2. Find the substitution and income effects
of this intervention when py = 4 and w = 16. [Hint: If needed, you can use the
expression for Hicksian demands from Week 3 solutions without explicitly deriving
them |
(¢) Consider the original case with py = 4, p; = 3 and w = 16. Suppose that Aaron is
given a $4 food voucher that he can spend to buy beans or rice. Will Aaron buy more
rice? Explain.
Question:
Give step-by-step solution with explanation and final answer:Problem 3. (Effects of Price Change) Aaron has the following utility function
u(r, 72) = min{z: + 8,201 + 202),
where 2, is the quantity of beans and is the quantity of rice consumed by Aaron (hoth
are measured in kilograms). The price of beans is py > 0 and the price of rice is p; > 0.
(a) State Aaron’s utility maximization problem and derive his Walrasian demand for each
good. [Hint: Walrasian demand is a correspondence. A graphical depiction of UMP
would hint out the solution. Refer to the solutions of week 3 problems to see the
shapes of the indifference curves.)
(b) Suppose that p, = 4. On a graph where the price is on a vertical axis, depict two
demand curves for rice, 25(4, pa, w), one when w = 24 and another when w = 16.
(¢) What can you deduce about Aaron's perception of rice. Is it an ordinary, Giffen.
normal or inferior good? Explain.
(d) Suppose that the government introduces a subsidy on rice thus making the market
price of rice to fall from p; = 3 to p= 2. Find the substitution and income effects
of this intervention when py = 4 and w = 16. [Hint: If needed, you can use the
expression for Hicksian demands from Week 3 solutions without explicitly deriving
them |
(¢) Consider the original case with py = 4, p; = 3 and w = 16. Suppose that Aaron is
given a $4 food voucher that he can spend to buy beans or rice. Will Aaron buy more
rice? Explain.
This is AI generated Response.
Asked by: Vikram Kumar
Created at: 2025-10-25 02:49:00
Final Answer:
RenderedRaw Text
Did you like this answer?
Let's go through each part step-by-step with explanations:
---
## Given Data:
- Utility function: \( u(x_1, x_2) = \min \{ x_1 + 8, 2x_1 + 2x_2 \} \)
- \( p_1 > \), \( p_2 > \)
- Budget constraint: \( p_1 x_1 + p_2 x_2 \leq w \)
---
## (a) State Aaron’s utility maximization problem and derive his Walrasian demand
### Step 1: Understand the utility function
The utility is the minimum of two expressions:
- \( x_1 + 8 \)
- \( 2x_1 + 2x_2 \)
To maximize utility, Aaron will choose \( x_1 \) and \( x_2 \) to make these two expressions equal (since utility is the minimum of the two, the maximum occurs when they are equal):
\[
x_1 + 8 = 2x_1 + 2x_2
\]
### Step 2: Solve for the equality
\[
x_1 + 8 = 2x_1 + 2x_2
\]
\[
8 = x_1 + 2x_2
\]
\[
x_1 = 8 - 2x_2
\]
### Step 3: Write the utility in terms of \( x_2 \)
Since at optimality, the utility is the common value:
\[
u = x_1 + 8 = (8 - 2x_2) + 8 = 16 - 2x_2
\]
### Step 4: Budget constraint
\[
p_1 x_1 + p_2 x_2 \leq w
\]
\[
p_1 (8 - 2x_2) + p_2 x_2 \leq w
\]
\[
8 p_1 - 2 p_1 x_2 + p_2 x_2 \leq w
\]
\[
( -2 p_1 + p_2) x_2 \leq w - 8 p_1
\]
---
## (b) Derive the demand for \( x_1 \) and \( x_2 \)
### Step 1: Find the interior solution
- When \( -2 p_1 + p_2 \neq \), solve for \( x_2 \):
\[
x_2 = \frac{w - 8 p_1}{p_2 - 2 p_1}
\]
- Since \( x_1 = 8 - 2 x_2 \):
\[
x_1 = 8 - 2 \times \frac{w - 8 p_1}{p_2 - 2 p_1}
\]
### Step 2: Check for corner solutions
- If the demand for \( x_2 \) is negative, the consumer will choose \( x_2= \), and similarly for \( x_1 \).
### **Final demand functions:**
\[
\boxed{
x_2^* = \max \left\{ , \frac{w - 8 p_1}{p_2 - 2 p_1} \right\}
}
\]
\[
x_1^* = 8 - 2 x_2^*
\]
---
## (c) Can you deduce Aaron’s perception of rice?
Since the utility depends on the minimum of two expressions, Aaron perceives rice as complementary to beans, with a "threshold" or "limiting" effect. When \( x_1 + 8 \) is less than \( 2x_1 + 2x_2 \), the utility is limited by \( x_1 + 8 \), so rice is somewhat "fixed" in the utility. The overall perception suggests that rice and beans are **complementary** in the sense that the utility hinges on the *minimum* of the two, indicating that rice consumption sets a cap unless beans are increased sufficiently.
---
## (d) If the price of rice drops to \( p_2' = 2 \), find the new demand for \( x_1, x_2 \) when \( p_1=4 \) and \( w=16 \).
### Step 1: Calculate \( x_2 \):
\[
x_2 = \frac{w - 8 p_1}{p_2 - 2 p_1} = \frac{16 - 8 \times 4}{2 - 2 \times 4} = \frac{16 - 32}{2 - 8} = \frac{-16}{-6} = \frac{8}{3}
\]
which is positive, so demand exists.
### Step 2: Find \( x_1 \):
\[
x_1 = 8 - 2 \times \frac{8}{3} = 8 - \frac{16}{3} = \frac{24 - 16}{3} = \frac{8}{3}
\]
### **Answer:**
\[
\boxed{
x_1 = \frac{8}{3} \quad,\quad x_2 = \frac{8}{3}
}
\]
---
## (e) Final explanation for the original case \( p_1=4, p_2=3, w=16 \)
- Compute \( x_2 \):
\[
x_2 = \frac{16 - 8 \times 4}{3 - 2 \times 4} = \frac{16 - 32}{3 - 8} = \frac{-16}{-5} = \frac{16}{5}
\]
which is positive.
- Compute \( x_1 \):
\[
x_1 = 8 - 2 \times \frac{16}{5} = 8 - \frac{32}{5} = \frac{40}{5} - \frac{32}{5} = \frac{8}{5}
\]
**Thus, demand:**
\[
x_1 = \frac{8}{5} = 1.6, \quad x_2 = \frac{16}{5} = 3.2
\]
---
# **Summary of Final Results**
| Part | Demand \( x_1 \) | Demand \( x_2 \) |
|---------|---------------------|---------------------|
| (b) | \( x_1 = 8 - 2 x_2 \) | \( x_2 = \max \left\{ , \frac{w - 8 p_1}{p_2 - 2 p_1} \right\} \) |
| (d) | \( x_1 = \frac{8}{3} \) | \( x_2 = \frac{8}{3} \) |
| (e) | \( x_1 = 1.6 \) | \( x_2 = 3.2 \) |
---
If you'd like, I can help clarify any step further!
Question:
utility function , demand , difination
This is AI generated Response.
Asked by: Vikram Kumar
Created at: 2025-10-25 03:03:32
Final Answer:
RenderedRaw Text
Did you like this answer?
# Utility Maximization Problem for Aaron
## Given Data:
- **Utility function:** \( u(x_1, x_2) = \min \{ x_1 + 8, 2x_1 + 2x_2 \} \)
- **Prices:** \( p_1 > 0 \) (Price of beans), \( p_2 > 0 \) (Price of rice)
- **Budget constraint:** \( p_1 x_1 + p_2 x_2 \leq w \) (where \( w \) is total wealth)
---
## (a) Utility Maximization Problem and Walrasian Demand
### Step 1: Understanding the Utility Function
The utility is defined as the minimum of two expressions:
1. \( x_1 + 8 \)
2. \( 2x_1 + 2x_2 \)
To maximize utility, Aaron should set these expressions equal:
\[
x_1 + 8 = 2x_1 + 2x_2
\]
### Step 2: Solve the Equality
Rearranging gives:
\[
8 = x_1 + 2x_2 \quad \Rightarrow \quad x_1 = 8 - 2x_2
\]
### Step 3: Substitute in the Budget Constraint
Substituting for \( x_1 \) in the budget constraint:
\[
p_1(8 - 2x_2) + p_2x_2 \leq w
\]
Expanding this gives:
\[
8p_1 - 2p_1x_2 + p_2x_2 \leq w
\]
Rearranging leads to:
\[
(-2p_1 + p_2)x_2 \leq w - 8p_1
\]
### Step 4: Solving for \( x_2 \)
Assuming \( -2p_1 + p_2 \neq 0 \):
\[
x_2^* = \frac{w - 8p_1}{p_2 - 2p_1}
\]
### Step 5: Finding \( x_1 \)
Substituting \( x_2^* \) back in:
\[
x_1^* = 8 - 2x_2^* = 8 - 2\left(\frac{w - 8p_1}{p_2 - 2p_1}\right)
\]
---
## (b) Demand Curves for Rice
### Given:
- \( p_1 = 4 \)
- \( w = 24 \) and \( w = 16 \)
### Calculation for \( w = 24 \):
\[
x_2 = \frac{24 - 32}{p_2 - 8} \quad \text{(substituting for } p_2 = 3 \text{)}
\]
\[
= \frac{-8}{3 - 8} = \frac{-8}{-5} = \frac{8}{5}
\]
### Calculation for \( w = 16 \):
\[
x_2 = \frac{16 - 32}{p_2 - 8} = \frac{-16}{3 - 8} = \frac{-16}{-5} = \frac{16}{5}
\]
### Graph:
- **Vertical Axis:** Price of Rice (\( p_2 \))
- **Horizontal Axis:** Quantity of Rice (\( x_2 \))
Include two demand curves for rice, one for each wealth level.
---
## (c) Aaron's Perception of Rice
### Analysis:
- The utility function suggests that rice and beans are **complementary goods**.
- If the quantity of beans increases, it directly influences the utility derived from rice.
- Therefore, rice is considered a **normal good** since an increase in wealth leads to an increase in demand for rice.
---
## (d) Effects of Price Change with Subsidy
### Step 1: New Price of Rice
- New price \( p_2' = 2 \)
### Step 2: Recalculate Demand
Using the newly set price:
\[
x_2 = \frac{16 - 32}{2 - 8} = \frac{-16}{-6} = \frac{8}{3}
\]
### Step 3: Find \( x_1 \)
\[
x_1 = 8 - 2 \times \frac{8}{3} = 8 - \frac{16}{3} = \frac{24 - 16}{3} = \frac{8}{3}
\]
### Effects of Subsidy:
- **Substitution Effect:** Shift in consumption towards rice as the price decreases.
- **Income Effect:** Increased purchasing power leads to more consumption.
---
## (e) Food Voucher Impact
### Given:
- \( p_1 = 4 \), \( p_2 = 3 \), \( w = 16 \)
- Additional food voucher of $4.
### Analysis:
- With the voucher, the new wealth becomes \( w = 20 \).
- Recalculate \( x_2 \):
\[
x_2 = \frac{20 - 32}{3 - 8} = \frac{-12}{-5} = \frac{12}{5}
\]
### Conclusion:
Aaron will buy more rice because the increase in wealth from the voucher allows for greater consumption of both goods, particularly rice.
---
# **Summary of Final Results**
| Part | Demand \( x_1 \) | Demand \( x_2 \) |
|------|------------------|------------------|
| (b) | \( x_1 = 8 - 2x_2 \) | \( x_2 = \frac{w - 8p_1}{p_2 - 2p_1} \) |
| (d) | \( x_1 = \frac{8}{3} \) | \( x_2 = \frac{8}{3} \) |
| (e) | \( x_1 = \frac{8}{5} \) | \( x_2 = \frac{12}{5} \) |
---
This concise breakdown provides a structured approach to solving the utility maximization problem, analyzing demand, and understanding the effects of price changes and income adjustments. If you need further clarification on any specific parts, feel free to ask!
Question:
b) Demand Curves for Rice
Given:
p
1
=
4
p
1
=4
w
=
24
w=24 and
w
=
16
w=16
Calculation for
w
=
24
w=24:
x
2
=
24
−
32
p
2
−
8
(substituting for
p
2
=
3
)
x
2
=
p
2
−8
24−32
(substituting for p
2
=3)
=
−
8
3
−
8
=
−
8
−
5
=
8
5
=
3−8
−8
=
−5
−8
=
5
8
Calculation for
w
=
16
w=16:
x
2
=
16
−
32
p
2
−
8
=
−
16
3
−
8
=
−
16
−
5
=
16
5
x
2
=
p
2
−8
16−32
=
3−8
−16
=
−5
−16
=
5
16
Graph:
Vertical Axis: Price of Rice (
p
2
p
2
)
Horizontal Axis: Quantity of Rice (
x
2
x
2
)
Include two demand curves for rice, one for each wealth level. create graph
This is AI generated Response.
Asked by: Vikram Kumar
Created at: 2025-10-25 03:32:38
Final Answer:
RenderedRaw Text
Did you like this answer?
# Demand Curves for Rice
## Given Data
- **Price of Beans:** \( p_1 = 4 \)
- **Wealth Levels:**
- \( w = 24 \)
- \( w = 16 \)
- **Price of Rice:** \( p_2 = 3 \)
---
## Calculations for Demand Curves
### 1. Demand Calculation for \( w = 24 \)
Using the formula for demand:
\[
x_2 = \frac{w - 8p_1}{p_2 - 2p_1}
\]
Substituting values:
\[
x_2 = \frac{24 - 8 \times 4}{3 - 2 \times 4}
\]
Calculating the numerator and denominator:
\[
= \frac{24 - 32}{3 - 8} = \frac{-8}{-5} = \frac{8}{5}
\]
### 2. Demand Calculation for \( w = 16 \)
Using the same formula:
\[
x_2 = \frac{16 - 8p_1}{p_2 - 2p_1}
\]
Substituting values:
\[
x_2 = \frac{16 - 8 \times 4}{3 - 2 \times 4}
\]
Calculating the numerator and denominator:
\[
= \frac{16 - 32}{3 - 8} = \frac{-16}{-5} = \frac{16}{5}
\]
---
## Graph of Demand Curves
### Axes:
- **Vertical Axis:** Price of Rice (\( p_2 \))
- **Horizontal Axis:** Quantity of Rice (\( x_2 \))
### Demand Curves:
1. **For \( w = 24 \):**
- Demand at \( w = 24 \): \( x_2 = \frac{8}{5} \approx 1.6 \)
2. **For \( w = 16 \):**
- Demand at \( w = 16 \): \( x_2 = \frac{16}{5} \approx 3.2 \)
### Graph Representation:
You can create a graph based on the calculated demand values:
```plaintext
Price of Rice (p2)
|
|
| * (w=16, x2=3.2)
|
|
| * (w=24, x2=1.6)
|_____________________________
Quantity of Rice (x2)
```
- **Points plotted:**
- For \( w = 24 \), the demand curve intersects at approximately \( (1.6, 3) \).
- For \( w = 16 \), the demand curve intersects at approximately \( (3.2, 3) \).
---
This structure clearly communicates the calculations and the graphical representation of the demand curves for rice based on different wealth levels. If you need further assistance or a more detailed graph, please let me know!
VIPSolutions focuses on clear, step‑by‑step explanations so you can learn quickly. Whether you need an AI‑generated walkthrough or a short hint to get unstuck, each solution is organized for fast reading and easy review later.
Search similar questions, compare approaches, and bookmark the best answers for revision. Our goal is simple: quick, reliable study help that feels natural—not noisy.
 VIPSolutions
 Problem 3. (Effects of Price Change) Aaron has the following utility function
u(r, 72) = min{z: + 8,201 + 202),
where 2, is the quantity of beans and is the quantity of rice consumed by Aaron (hoth
are measured in kilograms). The price of beans is py > 0 and the price of rice is p; > 0.
(a) State Aaron’s utility maximization problem and derive his Walrasian demand for each
good. [Hint: Walrasian demand is a correspondence. A graphical depiction of UMP
would hint out the solution. Refer to the solutions of week 3 problems to see the
shapes of the indifference curves.)
(b) Suppose that p, = 4. On a graph where the price is on a vertical axis, depict two
demand curves for rice, 25(4, pa, w), one when w = 24 and another when w = 16.
(¢) What can you deduce about Aaron's perception of rice. Is it an ordinary, Giffen.
normal or inferior good? Explain.
(d) Suppose that the government introduces a subsidy on rice thus making the market
price of rice to fall from p; = 3 to p= 2. Find the substitution and income effects
of this intervention when py = 4 and w = 16. [Hint: If needed, you can use the
expression for Hicksian demands from Week 3 solutions without explicitly deriving
them |
(¢) Consider the original case with py = 4, p; = 3 and w = 16. Suppose that Aaron is
given a $4 food voucher that he can spend to buy beans or rice. Will Aaron buy more
rice? Explain.