 VIPSolutions
Give step-by-step solution with explanation and final answer:: ame that aim ina monapostcall competitive marke faces Usshped 2 An curve, constant marginal cost of ¢ and a market demand sve ps oc Speaume hac
Question:
Give step-by-step solution with explanation and final answer: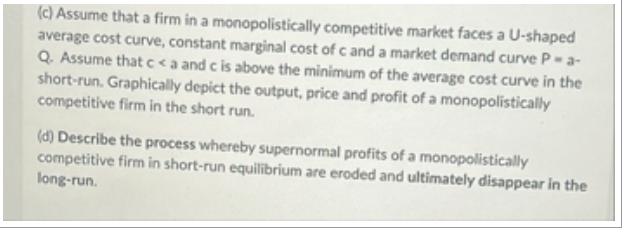 : ame that aim ina monapostcall competitive marke faces Usshped
2 An curve, constant marginal cost of ¢ and a market demand sve ps oc
Speaume hac
This is AI generated Response.
Asked by: Vikram Kumar
Created at: 2025-10-21 06:23:32
Asked by: Vikram Kumar
Created at: 2025-10-21 06:23:32
Final Answer:
Rendered
Raw Text
Did you like this answer?
Let's analyze the problem step-by-step.
---
## Part (c): Graphically depict the output, price, and profit of a monopolistically competitive firm in the short run
### Step 1: Understand the given data
- The firm faces a **U-shaped average cost curve (AC)** with a **constant marginal cost (MC)**, say \( c \).
- The **market demand curve** is downward sloping, with a **market price \( P \)** that is **above the minimum of the AC curve**.
- The firm operates in the **short run**.
### Step 2: Basic assumptions
- Since \( c \) is constant, the **MC** curve is a horizontal line at \( c \).
- **Price \( P \)** is above the **minimum average cost**, so the firm makes **supernormal profit** in the short run.
### Step 3: Graphical depiction
- Draw the **U-shaped average cost curve (AC)**.
- Draw the **marginal cost (MC)** curve as a horizontal line at \( c \).
- Draw the **market demand curve \( D \)**, which is downward sloping.
- Find the **profit-maximizing output \( Q^* \)** where **MC = MR** (marginal revenue). For simplicity, assume the firm sets \( Q^* \) where \( MC = MR \), and the corresponding **price \( P^* \)** on the demand curve at \( Q^* \).
- The **average revenue (AR)** curve coincides with the demand curve \( P \).
### Step 4: Determine profit area
- The **profit per unit** is \( P^* - AC(Q^*) \).
- The **total profit** is represented as the **rectangle** with height \( P^* - AC(Q^*) \) and width \( Q^* \).
---
## Part (d): Describe the process whereby supernormal profits are eroded and ultimately disappear in the long run
### Step 1: Recognize the impact of supernormal profits
- When firms in a monopolistically competitive market earn **supernormal profits**, **new firms** are attracted to the market due to the **profit incentive**.
### Step 2: Entry of new firms
- The entry of new firms increases **product differentiation** options and **market supply**, causing the **market demand curve** faced by existing firms to **shift inward** (or the individual firm's demand curve to **become more elastic**).
### Step 3: Shift in demand curve
- As **more firms** enter, the **demand curve** for each existing firm **shifts leftward** (becomes flatter) because consumers now have more substitutes.
### Step 4: Adjustment of equilibrium
- The **price** that the firm can charge **decreases**.
- The **supernormal profit** diminishes as the **price approaches the average cost**.
- Eventually, the **price equals the average cost** at the profit-maximizing output.
### Step 5: Long-run equilibrium
- **Supernormal profits** are **eroded**.
- The firm makes **normal profit** (zero economic profit).
- **Entry stops** because no more supernormal profits attract new firms.
---
## **Summary:**
- **Graphically (short run):** The firm operates where \( MC = MR \), with the price on the demand curve above the AC curve, resulting in supernormal profits.
- **Long run:** Entry of new firms shifts the demand curve inward, reducing the firm's price and supernormal profits until only normal profit remains.
---
**Final notes:** This process illustrates classic monopolistic competition dynamics where **free entry and exit** lead to **normal profits** in the long run.
---
Let me know if you'd like me to create a detailed diagram or further elaboration!
Question:
average cost curve (AC) with a constant marginal cost (MC) means only 30 word explain
This is AI generated Response.
Asked by: Vikram Kumar
Created at: 2025-10-21 06:40:03
Asked by: Vikram Kumar
Created at: 2025-10-21 06:40:03
Final Answer:
Rendered
Raw Text
Did you like this answer?
The average cost curve (AC) is U-shaped, indicating initial economies of scale, while the constant marginal cost (MC) line remains horizontal. This implies that production costs per unit stabilize after a certain output level.
📢 Instructions:
- Ask anything relatd to above question only.
- For new Question goto :