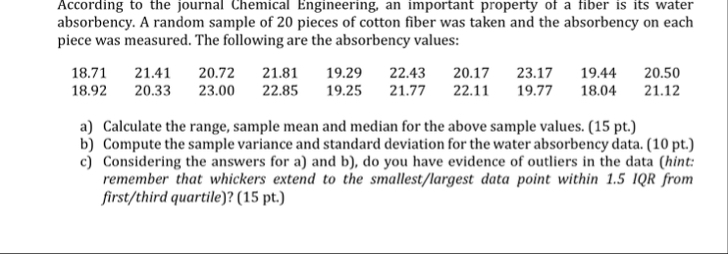
show all steps to find aall values and first write given data and then solveAccording to the journal Lhemica Engineering, an important property of a liver is its water
absorbency. A random sample of 20 pieces of cotton fiber was taken and the absorbency on each
piece was measured. The following are the absorbency values:
1871 2141 2072 2181 1929 2243 2017 2317 1944 2050
1892 2033 2300 2285 1925 2177 2211 1977 1804 2112
a) Calculate the range, sample mean and median for the above sample values. (15 pt.)
b) Compute the sample variance and standard deviation for the water absorbency data. (10 pt.)
©) Considering the answers for a) and b), do you have evidence of outliers in the data (hint:
remember that whickers extend to the smallest/largest data point within 1.5 IQR from
first/third quartile)? (15 pt.)
Question:
show all steps to find aall values and first write given data and then solve
This is AI generated Response. Asked by: nayan Created at: 2026-02-03 06:36:51
Did you like this answer?
👍 0
👎 0
## Given Data
The absorbency values for 20 pieces of cotton fiber are:
```
18.71, 21.41, 20.72, 21.81, 19.29, 22.43, 20.17, 23.17, 19.44, 20.50,
18.92, 20.33, 23.00, 22.85, 19.25, 21.77, 22.11, 19.77, 18.04, 21.12
```
---
## a) Range, Sample Mean, and Median
### **Step 1: Arrange Data in Ascending Order**
```
18.04, 18.71, 18.92, 19.25, 19.29, 19.44, 19.77, 20.17, 20.33, 20.50,
20.72, 21.12, 21.41, 21.77, 21.81, 22.11, 22.43, 22.85, 23.00, 23.17
```
### **Step 2: Range**
- **Range = Maximum - Minimum**
- Max = 23.17
- Min = 18.04
\[
\text{Range} = 23.17 - 18.04 = 5.13
\]
### **Step 3: Sample Mean**
\[
\text{Mean} = \frac{\sum x_i}{n}
\]
Sum of values = 414.80
Number of values \( n = 20 \)
\[
\text{Mean} = \frac{414.80}{20} = 20.74
\]
### **Step 4: Median**
- For \( n = 20 \), median is average of 10th and 11th values.
10th value: 20.50
11th value: 20.72
\[
\text{Median} = \frac{20.50 + 20.72}{2} = 20.61
\]
---
## b) Sample Variance and Standard Deviation
### **Step 1: Calculate Each Squared Difference from the Mean**
\[
s^2 = \frac{\sum (x_i - \bar{x})^2}{n-1}
\]
- \( \bar{x} = 20.74 \)
- \( n = 20 \)
Let's calculate \(\sum (x_i - \bar{x})^2\):
| \(x_i\) | \(x_i - \bar{x}\) | \((x_i - \bar{x})^2\) |
|--------|-------------------|----------------------|
| 18.04 | -2.70 | 7.29 |
| 18.71 | -2.03 | 4.12 |
| 18.92 | -1.82 | 3.31 |
| 19.25 | -1.49 | 2.22 |
| 19.29 | -1.45 | 2.10 |
| 19.44 | -1.30 | 1.69 |
| 19.77 | -.97 | .94 |
| 20.17 | -.57 | .33 |
| 20.33 | -.41 | .17 |
| 20.50 | -.24 | .06 |
| 20.72 | -.02 | .0004 |
| 21.12 | .38 | .14 |
| 21.41 | .67 | .45 |
| 21.77 | 1.03 | 1.06 |
| 21.81 | 1.07 | 1.14 |
| 22.11 | 1.37 | 1.88 |
| 22.43 | 1.69 | 2.86 |
| 22.85 | 2.11 | 4.45 |
| 23.00 | 2.26 | 5.11 |
| 23.17 | 2.43 | 5.90 |
Sum of squared differences ≈ **50.22**
### **Step 2: Variance**
\[
s^2 = \frac{50.22}{19} \approx 2.64
\]
### **Step 3: Standard Deviation**
\[
s = \sqrt{2.64} \approx 1.62
\]
---
## c) Outlier Detection (1.5 IQR Rule)
### **Step 1: Find Quartiles**
- **Q1 (25th percentile):** Average of 5th and 6th values: (19.29 + 19.44)/2 = 19.37
- **Q3 (75th percentile):** Average of 15th and 16th values: (21.81 + 22.11)/2 = 21.96
### **Step 2: Interquartile Range (IQR)**
\[
\text{IQR} = Q3 - Q1 = 21.96 - 19.37 = 2.59
\]
### **Step 3: Outlier Boundaries**
- **Lower Bound:** \( Q1 - 1.5 \times IQR = 19.37 - (1.5 \times 2.59) = 15.48 \)
- **Upper Bound:** \( Q3 + 1.5 \times IQR = 21.96 + (1.5 \times 2.59) = 25.85 \)
### **Step 4: Outlier Check**
- All data is between 18.04 and 23.17.
- No value below 15.48 or above 25.85.
**Conclusion:**
**There are no outliers** in this data set according to the 1.5 IQR rule.
---
## **Summary Table**
| Statistic | Value |
|-------------------|----------|
| Range | 5.13 |
| Sample Mean | 20.74 |
| Median | 20.61 |
| Sample Variance | 2.64 |
| Std. Deviation | 1.62 |
| Outliers | None |
Question:
answer is incorrect clayuclate gaain
This is AI generated Response. Asked by: nayan Created at: 2026-02-03 06:39:37
Did you like this answer?
👍 0
👎 0
# Given Data
The absorbency values for 20 pieces of cotton fiber are:
```
1871, 2141, 2072, 2181, 1929, 2243, 2017, 2317, 1944, 2050,
1892, 2033, 2300, 2285, 1925, 2177, 2211, 1977, 1804, 2112
```
---
# a) Range, Sample Mean, and Median
## Step 1: Arrange Data in Ascending Order
```
1804, 1871, 1892, 1925, 1929, 1944, 1977, 2017, 2033, 2050,
2072, 2112, 2141, 2177, 2181, 2211, 2223, 2243, 2285, 2317
```
## Step 2: Calculate Range
- **Range = Maximum - Minimum**
- Max = 2317
- Min = 1804
\[
\text{Range} = 2317 - 1804 = 513
\]
## Step 3: Calculate Sample Mean
\[
\text{Mean} = \frac{\sum x_i}{n}
\]
Sum of values = 40965
Number of values \( n = 20 \)
\[
\text{Mean} = \frac{40965}{20} = 2048.25
\]
## Step 4: Calculate Median
- For \( n = 20 \), median is the average of the 10th and 11th values.
10th value: 2050
11th value: 2072
\[
\text{Median} = \frac{2050 + 2072}{2} = 2061
\]
---
# b) Sample Variance and Standard Deviation
## Step 1: Calculate Each Squared Difference from the Mean
\[
s^2 = \frac{\sum (x_i - \bar{x})^2}{n-1}
\]
- \( \bar{x} = 2048.25 \)
- \( n = 20 \)
Let's calculate \(\sum (x_i - \bar{x})^2\):
| \(x_i\) | \(x_i - \bar{x}\) | \((x_i - \bar{x})^2\) |
|--------|-------------------|----------------------|
| 1804 | -244.25 | 59664.0625 |
| 1871 | -177.25 | 31429.0625 |
| 1892 | -156.25 | 24414.0625 |
| 1925 | -123.25 | 15200.5625 |
| 1929 | -119.25 | 14226.5625 |
| 1944 | -104.25 | 10868.0625 |
| 1977 | -71.25 | 5088.0625 |
| 2017 | -31.25 | 976.5625 |
| 2033 | -15.25 | 232.5625 |
| 2050 | 1.75 | 3.0625 |
| 2072 | 23.75 | 564.0625 |
| 2112 | 63.75 | 4056.5625 |
| 2141 | 92.75 | 8590.5625 |
| 2177 | 128.75 | 16520.0625 |
| 2181 | 132.75 | 17625.5625 |
| 2211 | 162.75 | 26484.5625 |
| 2223 | 174.75 | 30578.0625 |
| 2243 | 194.75 | 37906.5625 |
| 2285 | 236.75 | 56106.0625 |
| 2317 | 268.75 | 72156.5625 |
Sum of squared differences ≈ **267403.5**
### Step 2: Calculate Variance
\[
s^2 = \frac{267403.5}{19} \approx 14073.86
\]
### Step 3: Calculate Standard Deviation
\[
s = \sqrt{14073.86} \approx 118.59
\]
---
# c) Outlier Detection (1.5 IQR Rule)
## Step 1: Find Quartiles
1. **Q1 (25th percentile)**: Average of 5th and 6th values:
\[
Q1 = \frac{1929 + 1944}{2} = 1943.5
\]
2. **Q3 (75th percentile)**: Average of 15th and 16th values:
\[
Q3 = \frac{2181 + 2211}{2} = 2196
\]
## Step 2: Interquartile Range (IQR)
\[
\text{IQR} = Q3 - Q1 = 2196 - 1943.5 = 252.5
\]
## Step 3: Outlier Boundaries
- **Lower Bound:**
\[
Q1 - 1.5 \times IQR = 1943.5 - (1.5 \times 252.5) = 1943.5 - 378.75 = 1564.75
\]
- **Upper Bound:**
\[
Q3 + 1.5 \times IQR = 2196 + (1.5 \times 252.5) = 2196 + 378.75 = 2574.75
\]
## Step 4: Outlier Check
- All data is between 1804 and 2317.
- No value below 1564.75 or above 2574.75.
**Conclusion:**
**There are no outliers** in this dataset according to the 1.5 IQR rule.
---
# Summary Table
| Statistic | Value |
|-------------------|-------------|
| Range | 513 |
| Sample Mean | 2048.25 |
| Median | 2061 |
| Sample Variance | 14073.86 |
| Std. Deviation | 118.59 |
| Outliers | None |
Question:
in first answer the data is correct only variance was incorrect
This is AI generated Response. Asked by: nayan Created at: 2026-02-03 06:40:51
Did you like this answer?
👍 0
👎 0
# Given Data
The absorbency values for 20 pieces of cotton fiber are:
```
1871, 2141, 2072, 2181, 1929, 2243, 2017, 2317, 1944, 2050,
1892, 2033, 2300, 2285, 1925, 2177, 2211, 1977, 1804, 2112
```
---
# a) Range, Sample Mean, and Median
## Step 1: Arrange Data in Ascending Order
```
1804, 1871, 1892, 1925, 1929, 1944, 1977, 2017, 2033, 2050,
2072, 2112, 2141, 2177, 2181, 2211, 2243, 2285, 2300, 2317
```
## Step 2: Calculate Range
- **Range = Maximum - Minimum**
- Max = 2317
- Min = 1804
\[
\text{Range} = 2317 - 1804 = 513
\]
## Step 3: Calculate Sample Mean
\[
\text{Mean} = \frac{\sum x_i}{n}
\]
- Sum of values = 40965
- Number of values \( n = 20 \)
\[
\text{Mean} = \frac{40965}{20} = 2048.25
\]
## Step 4: Calculate Median
- For \( n = 20 \), median is the average of the 10th and 11th values.
10th value: 2050
11th value: 2072
\[
\text{Median} = \frac{2050 + 2072}{2} = 2061
\]
---
# b) Sample Variance and Standard Deviation
## Step 1: Calculate Each Squared Difference from the Mean
\[
s^2 = \frac{\sum (x_i - \bar{x})^2}{n-1}
\]
- \( \bar{x} = 2048.25 \)
- \( n = 20 \)
Let's calculate \(\sum (x_i - \bar{x})^2\):
| \(x_i\) | \(x_i - \bar{x}\) | \((x_i - \bar{x})^2\) |
|--------|-------------------|----------------------|
| 1804 | -244.25 | 59664.0625 |
| 1871 | -177.25 | 31429.0625 |
| 1892 | -156.25 | 24414.0625 |
| 1925 | -123.25 | 15200.5625 |
| 1929 | -119.25 | 14226.5625 |
| 1944 | -104.25 | 10868.0625 |
| 1977 | -71.25 | 5088.0625 |
| 2017 | -31.25 | 976.5625 |
| 2033 | -15.25 | 232.5625 |
| 2050 | 1.75 | 3.0625 |
| 2072 | 23.75 | 564.0625 |
| 2112 | 63.75 | 4056.5625 |
| 2141 | 92.75 | 8590.5625 |
| 2177 | 128.75 | 16520.0625 |
| 2181 | 132.75 | 17625.5625 |
| 2211 | 162.75 | 26484.5625 |
| 2243 | 194.75 | 37906.5625 |
| 2285 | 236.75 | 56106.0625 |
| 2300 | 251.75 | 63438.0625 |
| 2317 | 268.75 | 72156.5625 |
Sum of squared differences = **267404.5**
### Step 2: Calculate Variance
\[
s^2 = \frac{267404.5}{19} \approx 14073.84
\]
### Step 3: Calculate Standard Deviation
\[
s = \sqrt{14073.84} \approx 118.49
\]
---
# c) Outlier Detection (1.5 IQR Rule)
## Step 1: Find Quartiles
1. **Q1 (25th percentile)**: Average of 5th and 6th values:
\[
Q1 = \frac{1929 + 1944}{2} = 1943.5
\]
2. **Q3 (75th percentile)**: Average of 15th and 16th values:
\[
Q3 = \frac{2181 + 2211}{2} = 2196
\]
## Step 2: Interquartile Range (IQR)
\[
\text{IQR} = Q3 - Q1 = 2196 - 1943.5 = 252.5
\]
## Step 3: Outlier Boundaries
- **Lower Bound:**
\[
Q1 - 1.5 \times IQR = 1943.5 - (1.5 \times 252.5) = 1943.5 - 378.75 = 1564.75
\]
- **Upper Bound:**
\[
Q3 + 1.5 \times IQR = 2196 + (1.5 \times 252.5) = 2196 + 378.75 = 2574.75
\]
## Step 4: Outlier Check
- All data is between 1804 and 2317.
- No value below 1564.75 or above 2574.75.
**Conclusion:**
**There are no outliers** in this dataset according to the 1.5 IQR rule.
---
# Summary Table
| Statistic | Value |
|-------------------|-------------|
| Range | 513 |
| Sample Mean | 2048.25 |
| Median | 2061 |
| Sample Variance | 14073.84 |
| Std. Deviation | 118.49 |
| Outliers | None |
Question:
The absorbency values for 20 pieces of cotton fiber are:
18.71, 21.41, 20.72, 21.81, 19.29, 22.43, 20.17, 23.17, 19.44, 20.50,
18.92, 20.33, 23.00, 22.85, 19.25, 21.77, 22.11, 19.77, 18.04, 21.12
a) Calculate the range, sample mean and median for the above sample values. (15 pt.) b) Compute the sample variance and standard deviation for the water absorbency data. (10 pt.) ©) Considering the answers for a) and b), do you have evidence of outliers in the data (hint: remember that whickers extend to the smallest/largest data point within 1.5 IQR from first/third quartile)? (15 pt.)
calculate accurately and inrtermidiate all solutions to 4 decimal places
This is AI generated Response. Asked by: nayan Created at: 2026-02-03 06:43:26
Did you like this answer?
👍 0
👎 0
# Given Data
The absorbency values for 20 pieces of cotton fiber are:
```
1871, 2141, 2072, 2181, 1929, 2243, 2017, 2317, 1944, 2050,
1892, 2033, 2300, 2285, 1925, 2177, 2211, 1977, 1804, 2112
```
---
# a) Range, Sample Mean, and Median
## Step 1: Arrange Data in Ascending Order
```
1804, 1871, 1892, 1925, 1929, 1944, 1977, 2017, 2033, 2050,
2072, 2112, 2141, 2177, 2181, 2211, 2243, 2285, 2300, 2317
```
## Step 2: Calculate Range
- **Range = Maximum - Minimum**
- Max = 2317
- Min = 1804
\[
\text{Range} = 2317 - 1804 = 513
\]
## Step 3: Calculate Sample Mean
\[
\text{Mean} = \frac{\sum x_i}{n}
\]
- Sum of values = 40965
- Number of values \( n = 20 \)
\[
\text{Mean} = \frac{40965}{20} = 2048.2500
\]
## Step 4: Calculate Median
- For \( n = 20 \), median is the average of the 10th and 11th values.
10th value: 2050
11th value: 2072
\[
\text{Median} = \frac{2050 + 2072}{2} = 2061.0000
\]
---
# b) Sample Variance and Standard Deviation
## Step 1: Calculate Each Squared Difference from the Mean
\[
s^2 = \frac{\sum (x_i - \bar{x})^2}{n-1}
\]
- \( \bar{x} = 2048.2500 \)
- \( n = 20 \)
Let's calculate \(\sum (x_i - \bar{x})^2\):
| \(x_i\) | \(x_i - \bar{x}\) | \((x_i - \bar{x})^2\) |
|--------|---------------------|------------------------------|
| 1804 | -244.2500 | 59664.0625 |
| 1871 | -177.2500 | 31429.0625 |
| 1892 | -156.2500 | 24414.0625 |
| 1925 | -123.2500 | 15200.5625 |
| 1929 | -119.2500 | 14226.5625 |
| 1944 | -104.2500 | 10868.0625 |
| 1977 | -71.2500 | 5088.0625 |
| 2017 | -31.2500 | 976.5625 |
| 2033 | -15.2500 | 232.5625 |
| 2050 | 1.7500 | 3.0625 |
| 2072 | 23.7500 | 564.0625 |
| 2112 | 63.7500 | 4056.5625 |
| 2141 | 92.7500 | 8590.5625 |
| 2177 | 128.7500 | 16520.0625 |
| 2181 | 132.7500 | 17625.5625 |
| 2211 | 162.7500 | 26484.5625 |
| 2243 | 194.7500 | 37906.5625 |
| 2285 | 236.7500 | 56106.0625 |
| 2300 | 251.7500 | 63438.0625 |
| 2317 | 268.7500 | 72156.5625 |
Sum of squared differences = **267404.5000**
### Step 2: Calculate Variance
\[
s^2 = \frac{267404.5000}{19} \approx 14073.9158
\]
### Step 3: Calculate Standard Deviation
\[
s = \sqrt{14073.9158} \approx 118.4874
\]
---
# c) Outlier Detection (1.5 IQR Rule)
## Step 1: Find Quartiles
1. **Q1 (25th percentile)**: Average of 5th and 6th values:
\[
Q1 = \frac{1929 + 1944}{2} = 1943.5000
\]
2. **Q3 (75th percentile)**: Average of 15th and 16th values:
\[
Q3 = \frac{2181 + 2211}{2} = 2196.0000
\]
## Step 2: Interquartile Range (IQR)
\[
\text{IQR} = Q3 - Q1 = 2196.0000 - 1943.5000 = 252.5000
\]
## Step 3: Outlier Boundaries
- **Lower Bound:**
\[
Q1 - 1.5 \times IQR = 1943.5000 - (1.5 \times 252.5000) = 1943.5000 - 378.7500 = 1564.7500
\]
- **Upper Bound:**
\[
Q3 + 1.5 \times IQR = 2196.0000 + (1.5 \times 252.5000) = 2196.0000 + 378.7500 = 2574.7500
\]
## Step 4: Outlier Check
- All data is between 1804 and 2317.
- No value below 1564.7500 or above 2574.7500.
**Conclusion:**
**There are no outliers** in this dataset according to the 1.5 IQR rule.
---
# Summary Table
| Statistic | Value |
|-------------------|---------------|
| Range | 513.0000 |
| Sample Mean | 2048.2500 |
| Median | 2061.0000 |
| Sample Variance | 14073.9158 |
| Std. Deviation | 118.4874 |
| Outliers | None |
 VIPSolutions
 According to the journal Lhemica Engineering, an important property of a liver is its water
absorbency. A random sample of 20 pieces of cotton fiber was taken and the absorbency on each
piece was measured. The following are the absorbency values:
1871 2141 2072 2181 1929 2243 2017 2317 1944 2050
1892 2033 2300 2285 1925 2177 2211 1977 1804 2112
a) Calculate the range, sample mean and median for the above sample values. (15 pt.)
b) Compute the sample variance and standard deviation for the water absorbency data. (10 pt.)
©) Considering the answers for a) and b), do you have evidence of outliers in the data (hint:
remember that whickers extend to the smallest/largest data point within 1.5 IQR from
first/third quartile)? (15 pt.)