 VIPSolutions
Act like a helpful tutor and exlain me :wr fon sere Qed Gill 1 il : Jal HERE 1 i i : ; i H | i jt we i i kin Lgl
Question:
Act like a helpful tutor and exlain me :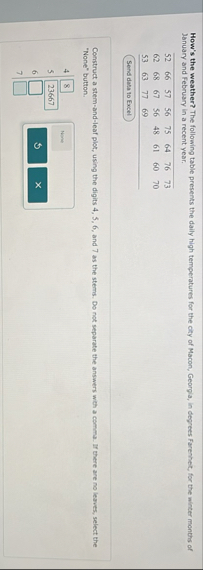 wr fon
sere Qed
Gill 1
il : Jal
HERE
1
i i
: ;
i H
| i
jt
we
i i
kin Lgl
This is AI generated Response.
Asked by: Alok Kumar
Created at: 2026-01-27 06:23:45
Asked by: Alok Kumar
Created at: 2026-01-27 06:23:45
Final Answer:
Rendered
Raw Text
Did you like this answer?
Sure! Let's break down the problem step by step.
---
## **Problem Explanation**
You are given a **list of daily high temperatures** for a city during January and February.
The temperatures are:
```
52, 60, 57, 55, 63, 68, 73,
53, 62, 77, 59, 66, 61, 76,
50, 48, 61, 60, 70
```
### **Question**
> Construct a stem-and-leaf plot using the digits 4, 5, 6, and 7 as the stems.
> Do **not repeat** the stems in the answer.
> If there are no leaves, specify the stem, but leave it blank.
---
## **What is a Stem-and-Leaf Plot?**
A **stem-and-leaf plot** is a way to organize data so you can see its shape and distribution.
- **Stem:** Represents the leading digit(s) (here: tens).
- **Leaf:** Represents the trailing digit (here: ones).
**Example:**
If we have 57:
- Stem = 5
- Leaf = 7
---
## **Step 1: Organize the Data**
Let's sort the data to make it easier:
```
48, 50, 52, 53, 55, 57, 59, 60, 60, 61, 61, 62, 63, 66, 68, 70, 73, 76, 77
```
---
## **Step 2: Make the Stem-and-Leaf Plot**
- Stems: 4, 5, 6, 7 (the tens digit)
- Leaves: The ones digit for each temperature
### **Stem 4 (40-49)**
- 48
### **Stem 5 (50-59)**
- 50, 52, 53, 55, 57, 59
### **Stem 6 (60-69)**
- 60, 60, 61, 61, 62, 63, 66, 68
### **Stem 7 (70-79)**
- 70, 73, 76, 77
---
## **Step 3: Write It Out**
| Stem | Leaves |
|------|------------------|
| 4 | 8 |
| 5 | 2 3 5 7 9 |
| 6 | 1 1 2 3 6 8 |
| 7 | 3 6 7 |
---
## **How to Enter Answer**
Based on the interface in your image:
- Enter the leaves for each stem in order, separated by spaces.
- If a stem has no leaves, leave it blank.
So, for your answer you would enter:
```
4 | 8
5 | 2 3 5 7 9
6 | 1 1 2 3 6 8
7 | 3 6 7
```
Or, using the box format from your image:
- Stem: 4 | Leaves: 8
- Stem: 5 | Leaves: 2 3 5 7 9
- Stem: 6 | Leaves: 1 1 2 3 6 8
- Stem: 7 | Leaves: 3 6 7
---
## **Summary**
A stem-and-leaf plot helps you quickly see the distribution of the data.
Each "stem" is a group of tens, and each "leaf" is a single unit in that group.
Let me know if you have more questions or want to try another example!
📢 Instructions:
- Ask anything relatd to above question only.
- For new Question goto :