This is AI generated Response.
Asked by: Francis
Created at: 2026-01-18 12:53:12
Final Answer:
RenderedRaw Text
Did you like this answer?
Sure! Let’s tackle each part step by step:
---
## 1. Levenspiel Plot for Adiabatic Exothermic Reaction
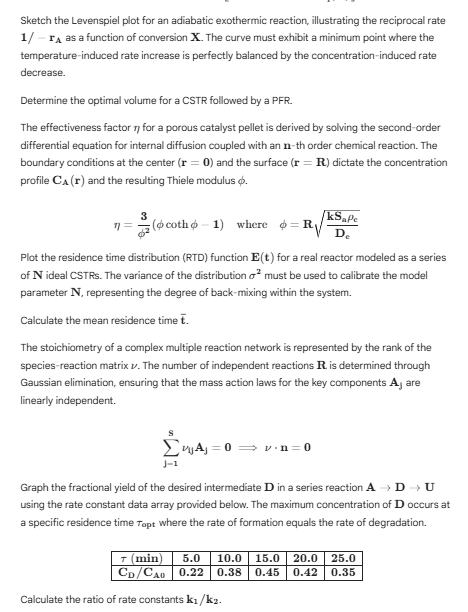
- **Plot:** Sketch \( \frac{1}{-r_A} \) vs. conversion \( X \).
- **Shape:** For an adiabatic exothermic reaction, as \( X \) increases, temperature rises, increasing rate (\( -r_A \) increases, so \( \frac{1}{-r_A} \) drops). But at higher \( X \), reactant is depleted, lowering rate (\( \frac{1}{-r_A} \) rises).
- **Key Feature:** The curve has a minimum—where the temperature effect (rate increases) and concentration effect (rate decreases) balance.
---
## 2. Optimal Volume for CSTR Followed by PFR
- **Optimal Volume:** For a given conversion, the most efficient arrangement is a CSTR first (to handle low conversion efficiently), then a PFR. To find the optimal split, you set up the material balances and minimize total volume.
---
## 3. Effectiveness Factor for Porous Catalyst Pellet
- **Definition:** The effectiveness factor \( \eta \) quantifies how efficiently the catalyst is used.
- **Equation:**
\[
\eta = \frac{3}{\phi^2} (\phi \coth \phi - 1)
\]
where
\[
\phi = R \sqrt{\frac{k S_a \rho_c}{D_e}}
\]
- **Boundary Conditions:** At \( r = \): symmetric, so \( \frac{dC_A}{dr} = \). At \( r = R \): matches surface concentration.
- **Interpretation:** \( \eta < 1 \) means diffusion limits the reaction.
---
## 4. Residence Time Distribution (RTD) for N CSTRs
- **E(t) for N CSTRs:**
\[
E(t) = \frac{N^N}{\bar{t} \Gamma(N)} \left( \frac{t}{\bar{t}} \right)^{N-1} e^{-N t/\bar{t}}
\]
- **Variance:**
\[
\sigma^2 = \frac{\bar{t}^2}{N}
\]
- **Parameter:** \( N \) models the degree of back-mixing.
---
## 5. Mean Residence Time
- **Mean Residence Time \( \bar{t} \):**
\[
\bar{t} = \int_^\infty t E(t) dt
\]
For N CSTRs in series, \( \bar{t} \) is the total reactor residence time.
---
## 6. Stoichiometry and Rank of Reaction Network
- **Rank of \( \nu \):** The number of independent reactions = rank of the stoichiometric matrix.
- **Mass Balances:** The sum over all reactions of stoichiometric coefficients times concentrations for each key component \( A_j \) equals zero.
\[
\sum_{j=1}^S \nu_{ij} A_j =
\]
- **Linear Independence:** Only \( R \) independent reactions; others are combinations.
---
## 7. Graphing the Desired Intermediate D
- **Given Data:**
\[
\begin{array}{c|cccccc}
\tau\ (\text{min}) & 5. & 10. & 15. & 20. & 25. \\
C_D/C_{A} & .22 & .38 & .45 & .42 & .35 \\
\end{array}
\]
- **Plot:** \( C_D/C_{A} \) vs. \( \tau \). The maximum is at \( \tau_{\text{opt}} = 15. \) min, where \( C_D/C_{A} = .45 \).
- **Interpretation:** At \( \tau_{\text{opt}} \), the rate of formation equals the rate of degradation of \( D \).
---
## 8. Calculating the Ratio of Rate Constants \( k_1/k_2 \)
Assume series reactions \( A \xrightarrow{k_1} D \xrightarrow{k_2} U \).
For a series of CSTRs, the steady-state fractional concentration of \( D \) is:
\[
\frac{C_D}{C_{A}} = \frac{k_1 \tau}{(k_2 - k_1)\tau} (e^{-k_1 \tau} - e^{-k_2 \tau})
\]
But for **maximum** \( D \), \( k_1 \exp(-k_1 \tau) = k_2 \exp(-k_2 \tau) \):
Take logs:
\[
\ln k_1 - k_1 \tau = \ln k_2 - k_2 \tau
\]
\[
\ln \frac{k_1}{k_2} = (k_1 - k_2)\tau
\]
Let \( \tau_{\text{opt}} = 15. \) min. Let \( \alpha = k_1/k_2 \).
Suppose \( k_1 \) and \( k_2 \) are close, use approximation or solve numerically:
\[
\ln \alpha = k_2 (\alpha - 1) \tau_{\text{opt}}
\]
But more commonly, for CSTRs in series, the maximum of \( C_D \) occurs at:
\[
k_1 \tau_{\text{opt}} = \frac{k_2}{k_1 - k_2} \ln \frac{k_1}{k_2}
\]
But for the **PFR**, the maximum occurs at \( k_1 \exp(-k_1 \tau) = k_2 \exp(-k_2 \tau) \), as above.
Usually, the ratio for the maximum can be estimated as:
\[
k_1 \exp(-k_1 \tau_{\text{opt}}) = k_2 \exp(-k_2 \tau_{\text{opt}})
\]
\[
\ln\left(\frac{k_1}{k_2}\right) = (k_1 - k_2)\tau_{\text{opt}}
\]
Let’s **estimate** numerically:
Let \( k_1 = \alpha k_2 \):
\[
\ln \alpha = k_2 (\alpha - 1) \tau_{\text{opt}}
\]
Choose \( \tau_{\text{opt}} = 15 \) min.
Suppose \( k_2 = x \), so:
\[
\ln \alpha = x(\alpha - 1) \cdot 15
\]
But we have two unknowns. Usually, you need the value of \( k_1 \tau_{\text{opt}} \) from a chart or table for the maximum (for a batch/PFR, it's at \( k_1 \tau = \ln(k_1/k_2) / (k_1/k_2 - 1) \)).
**Alternatively:** If you have a textbook or chart, you could match the maximum value with these parameters.
---
### **Summary Table**
| Task | Explanation |
|------|-------------|
| Levenspiel plot | Shows \( 1/-r_A \) vs. \( X \); has a minimum for adiabatic exothermic reaction |
| CSTR + PFR volume | Optimize by splitting conversion to minimize total volume |
| Effectiveness factor | \( \eta = \frac{3}{\phi^2} (\phi \coth \phi - 1) \) for a spherical pellet |
| RTD for N CSTRs | \( E(t) \) and variance \( \sigma^2 \) model back-mixing |
| Mean residence time | \( \bar{t} \) is the average time spent in reactor |
| Stoichiometry | Number of independent reactions is rank of \( \nu \) |
| Fractional yield graph | Plot \( C_D/C_{A} \) vs. \( \tau \). Max at \( \tau_{\text{opt}} \) |
| \( k_1/k_2 \) ratio | Requires solving \( \ln(k_1/k_2) = (k_1 - k_2)\tau_{\text{opt}} \) numerically |
---
If you want a specific calculation for \( k_1/k_2 \), let me know if this is a batch, PFR, or CSTR system, and I can walk you through the steps with the data!
VIPSolutions focuses on clear, step‑by‑step explanations so you can learn quickly. Whether you need an AI‑generated walkthrough or a short hint to get unstuck, each solution is organized for fast reading and easy review later.
Search similar questions, compare approaches, and bookmark the best answers for revision. Our goal is simple: quick, reliable study help that feels natural—not noisy.
 VIPSolutions
 Setch the Lovensiel lot oan abasic axcthrnic eacion, usaig the reciprocal rte
17 ra 25a fonction of cons X. The cive mst exist miriam pin wher he
amprstue-doced at crease is perfectly balanced bth concent duced ta
dares.
etre th pina lum ora CSTR lowed by a PF.
Th effectiveness foctor or porous catalyst pelts drive by shin he second rr
frat squation for tarmal ifsion coupled with a -th rr chersca reaction. The
ondary condions a he ceter ¢ — 0a a sefce (0) dette the concenvaton
rae Ci () a th eli Thick mks
s ES
“3 poms 1) where om [EE
= gbcoths 1) é Br
Pot the esdenc im dissin (40) uncon (©) for ral ctr msl 2 series
of N ideal CSTRs. The variance of the distribution a must be used to calibrate the model
parametr IN, representing the degre of backing vin the sem.
Calculate the mean residence time £.
Th stoichiometry fa complexe eso nor eprsentd bth ark of he
cis waco tis: Tha nr of dependent actions is deterind tough
Gaus finton, ening tht he ras action laws or th ey comport Ay are
[ow ——
Sud 0 — sno
=
raph th racine id of th desi termediate Dn asres reaction A. + DU
ein the ot constr daa ray peice bik: The maximum concaiationf D occrs ot
2 specfcresdanc im pe wher th ate of formation cues the ae of degradation
[mm [5 [00 T5000 350]
[Co/Cas [0.22 [0.35 [0.45 [042 [0.35]
Calo th ratio te constants es.