 VIPSolutions
Act like a helpful tutor and exlain me :Quarterly revenues (in millions of dollars) for nations! restaurant chain for & five-year period were as shows: in the following table. (Assume the time series has seasonality with trend.) fsa] » | o [ = [on [| le==t] » [we [a[n]=] (2) Sole forthe forecast equation that minimizes the sum of suared ero, (Ener your numerical values t fv decimal places.) J = 1 cuarter 1, 0 otherwise; x, = 1 I cuarer 2, 0 otherwise; x, = 1 I cuarter 3, 0 otherwise. Pp (0) Forecast the fou quarters of Year 6 in ions of dotrs). quarter 1 forecast millon quarter 2 forecast milion quarter 3 forecast milion auerter forecast millon SUBMIT ANSWER
Question:
Act like a helpful tutor and exlain me :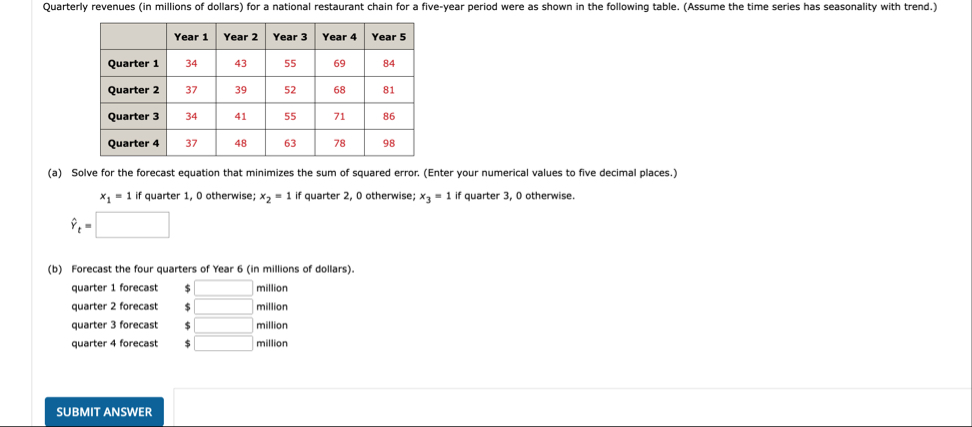 Quarterly revenues (in millions of dollars) for nations! restaurant chain for & five-year period were as shows: in the following table. (Assume the time series has seasonality with trend.)
fsa] » | o [ = [on [|
le==t] » [we [a[n]=]
(2) Sole forthe forecast equation that minimizes the sum of suared ero, (Ener your numerical values t fv decimal places.)
J = 1 cuarter 1, 0 otherwise; x, = 1 I cuarer 2, 0 otherwise; x, = 1 I cuarter 3, 0 otherwise.
Pp
(0) Forecast the fou quarters of Year 6 in ions of dotrs).
quarter 1 forecast millon
quarter 2 forecast milion
quarter 3 forecast milion
auerter forecast millon
SUBMIT ANSWER
This is AI generated Response.
Asked by: Umesh
Created at: 2025-07-28 23:54:17
Asked by: Umesh
Created at: 2025-07-28 23:54:17
Final Answer:
Rendered
Raw Text
Did you like this answer?
Absolutely! Let's break this problem into clear steps:
---
## **Given Data**
A table of **quarterly revenues** (in millions) for 5 years:
| | Year 1 | Year 2 | Year 3 | Year 4 | Year 5 |
|---------|--------|--------|--------|--------|--------|
| Q1 | 34 | 43 | 55 | 69 | 84 |
| Q2 | 37 | 39 | 52 | 68 | 81 |
| Q3 | 34 | 41 | 55 | 71 | 86 |
| Q4 | 37 | 48 | 63 | 78 | 98 |
Assume there is **seasonality and trend**.
---
## **(a) Find the Forecast Equation**
You are to fit a model with:
- **Trend** (changes over time)
- **Seasonality** (differences between quarters)
The model is:
\[
\hat{y}_t = a + b t + c_1 x_1 + c_2 x_2 + c_3 x_3
\]
Where:
- \( t \) = time period (1, 2, ..., 20 for all quarters)
- \( x_1, x_2, x_3 \) = dummy variables for quarters (x_1 for Q1, x_2 for Q2, x_3 for Q3, Q4 is the base case)
**Steps:**
1. Assign \( t \) values to all quarters (Q1 of Year 1 is t=1, Q2 is t=2, ..., Q4 of Year 5 is t=20).
2. For each data point, set dummy variables:
- If Q1: \( x_1 = 1, x_2 = 0, x_3 = 0 \)
- If Q2: \( x_1 = 0, x_2 = 1, x_3 = 0 \)
- If Q3: \( x_1 = 0, x_2 = 0, x_3 = 1 \)
- If Q4: \( x_1 = 0, x_2 = 0, x_3 = 0 \)
3. Fit the linear regression with these variables to get \( a, b, c_1, c_2, c_3 \).
**Your equation will look like:**
\[
\hat{y}_t = a + b t + c_1 x_1 + c_2 x_2 + c_3 x_3
\]
---
## **(b) Forecast Year 6**
Year 6 quarters are \( t = 21, 22, 23, 24 \).
- **Quarter 1**: \( t = 21, x_1 = 1, x_2 = 0, x_3 = 0 \)
- **Quarter 2**: \( t = 22, x_1 = 0, x_2 = 1, x_3 = 0 \)
- **Quarter 3**: \( t = 23, x_1 = 0, x_2 = 0, x_3 = 1 \)
- **Quarter 4**: \( t = 24, x_1 = 0, x_2 = 0, x_3 = 0 \)
Plug these values into your equation to get the forecasts.
---
## **Summary of Steps**
1. **Create a table with all variables** (t, y, x1, x2, x3).
2. **Fit the regression** to find coefficients.
3. **Plug in t and dummy variables for Year 6** to forecast.
---
### **If you want to compute by hand:**
You would set up a table like this for regression (showing just the first few rows as an example):
| t | y | x1 | x2 | x3 |
|----|----|----|----|----|
| 1 | 34 | 1 | 0 | 0 | (Year 1, Q1)
| 2 | 37 | 0 | 1 | 0 | (Year 1, Q2)
| 3 | 34 | 0 | 0 | 1 | (Year 1, Q3)
| 4 | 37 | 0 | 0 | 0 | (Year 1, Q4)
| ...| ...| ...| ...| ...|
Continue for all 20 quarters.
---
### **Would you like step-by-step calculations (fitting the regression), or do you want to use Excel or a calculator for this part?**
Let me know how detailed you want the computations!
📢 Instructions:
- Ask anything relatd to above question only.
- For new Question goto :