 VIPSolutions
Act like a helpful tutor and exlain me :Problem 2. Using the method of least squares, find the straight line equation that represents the stress-strain relation as obtained from your group experiment, with the strain being measured experimentally and stress computed from the theoretical analysis. Draw the curve and discuss the goodness of fit. Problem 3. Using the method of least squares, find the straight line equation that represents the values of elastic modulus as obtained from different group experiments, with the strain being measured experimentally and stress computed from the theoretical analysis. Draw the curve and discuss the goodness of fit. x1076 psi 4 | eer | 6 | 820 | 8 | 1152 | 9 | ~~ 987 |
Question:
Act like a helpful tutor and exlain me :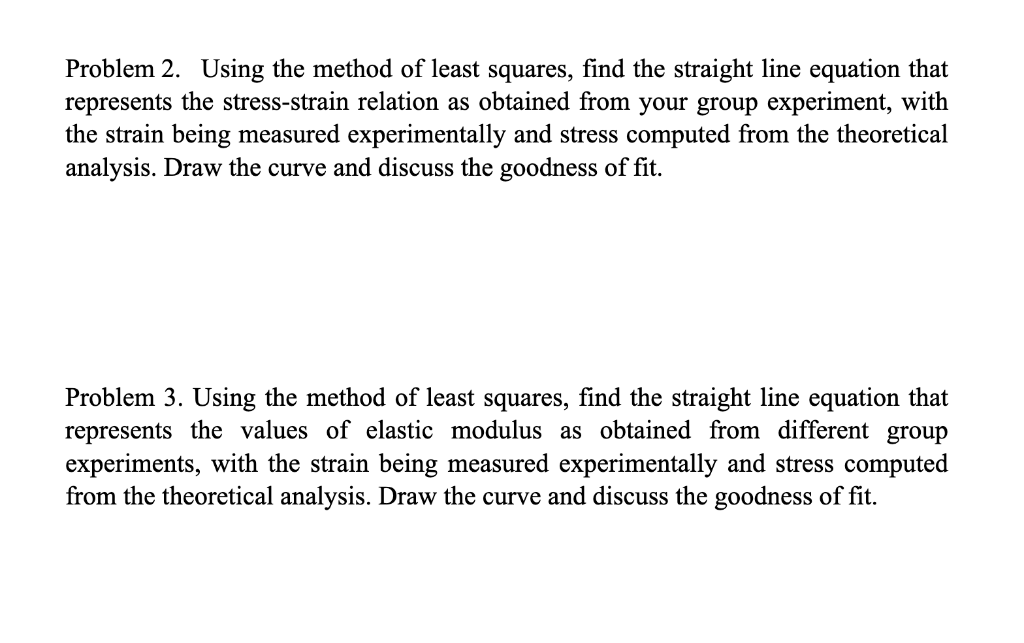
 Problem 2. Using the method of least squares, find the straight line equation that
represents the stress-strain relation as obtained from your group experiment, with
the strain being measured experimentally and stress computed from the theoretical
analysis. Draw the curve and discuss the goodness of fit.
Problem 3. Using the method of least squares, find the straight line equation that
represents the values of elastic modulus as obtained from different group
experiments, with the strain being measured experimentally and stress computed
from the theoretical analysis. Draw the curve and discuss the goodness of fit.
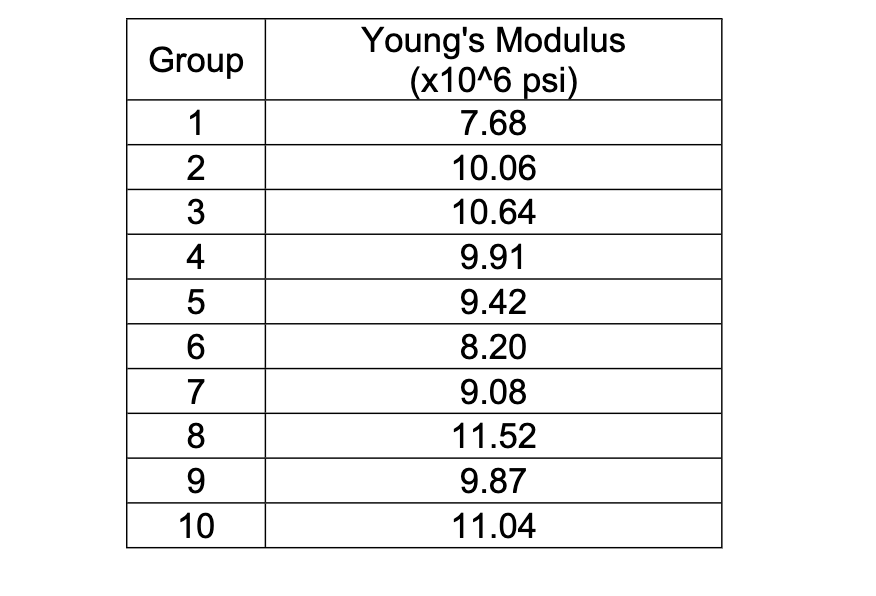
x1076 psi
4 | eer |
6 | 820 |
8 | 1152 |
9 | ~~ 987 |
This is AI generated Response.
Asked by: Umesh
Created at: 2025-08-01 23:05:39
Asked by: Umesh
Created at: 2025-08-01 23:05:39
Final Answer:
Rendered
Raw Text
Did you like this answer?
Let's break down both problems and the provided data step by step.
---
## Problem 2: Least Squares for Stress-Strain Relation
### **What is the Least Squares Method?**
The **least squares method** is a statistical technique to find the line (linear equation) that best fits a set of data points by minimizing the sum of the squares of the vertical distances (residuals) between the observed values and the values predicted by the line.
### **Stress-Strain Relationship**
The **stress-strain relationship** is typically linear for elastic materials:
\[
\sigma = E\epsilon
\]
where:
- \(\sigma\) = stress (y-axis)
- \(\epsilon\) = strain (x-axis)
- \(E\) = Young’s modulus (slope of the line)
### **Steps to Solve:**
1. **Collect Data:** You need a set of experimental strain values (\(\epsilon\)) and corresponding theoretical stress values (\(\sigma\)).
2. **Plot the Data:** Plot stress (y-axis) vs. strain (x-axis).
3. **Apply Least Squares:** Fit a straight line \(\sigma = a + b\epsilon\) (often, for elastic materials, \(a \approx 0\), so \(\sigma = b\epsilon\)).
- Slope \(b\) will be your experimental Young’s modulus.
4. **Draw the Curve:** Plot the best-fit line on your data.
5. **Goodness of Fit:** Discuss how well the line represents your data. You can use \(R^2\) value:
- \(R^2 \approx 1\): Good fit
- \(R^2\) much less than 1: Poor fit
---
## Problem 3: Least Squares for Young's Modulus Values
### **Given Data**
You have Young’s modulus values from 10 different groups (see your table).
| Group | Young's Modulus (\(x10^6\) psi) |
|-------|------------------------|
| 1 | 7.68 |
| 2 | 10.06 |
| 3 | 10.64 |
| 4 | 9.91 |
| 5 | 9.42 |
| 6 | 8.20 |
| 7 | 9.08 |
| 8 | 11.52 |
| 9 | 9.87 |
| 10 | 11.04 |
### **Steps to Solve:**
1. **Plot the Data:** Plot group number (x-axis) vs. Young's modulus (y-axis).
2. **Apply Least Squares:** Fit a straight line:
\[
E = a + bx
\]
where \(x\) = group number, \(E\) = Young’s modulus.
- Often, the trend should be flat (b ≈ 0) if there’s no systematic group-to-group difference.
3. **Draw the Curve:** Plot the best-fit line.
4. **Discuss Goodness of Fit:** Is the line flat? Is there a trend? How much do individual values deviate from the line? Compute and discuss \(R^2\).
---
## Example Calculation (for Problem 3):
Let’s **calculate the mean** (which is itself the best-fit line if there is no trend):
\[
\text{Mean} = \frac{7.68 + 10.06 + 10.64 + 9.91 + 9.42 + 8.20 + 9.08 + 11.52 + 9.87 + 11.04}{10}
\]
\[
= \frac{97.42}{10} = 9.742 \times 10^6 \text{ psi}
\]
So, your least squares "fit" is just a horizontal line at \(9.74 \times 10^6\) psi, if there’s no trend.
---
## **How to Draw the Curve (for Both Problems):**
- **X-Axis:** Strain (for Problem 2), Group Number (for Problem 3)
- **Y-Axis:** Stress (Problem 2), Young’s Modulus (Problem 3)
- **Data Points:** Plot your experimental values
- **Best-Fit Line:** Draw the line from least squares calculation
---
## **Goodness of Fit:**
- **Visual Inspection:** Do points cluster around the line?
- **\(R^2\) Value:** Calculate it to quantify the fit. \(R^2\) close to 1 means a good fit.
---
## **Summary Table for Problem 3:**
| Group | Young's Modulus (\(x10^6\) psi) | Deviation from Mean |
|-------|------------------------|----------------------|
| 1 | 7.68 | -2.06 |
| 2 | 10.06 | 0.32 |
| 3 | 10.64 | 0.90 |
| 4 | 9.91 | 0.17 |
| 5 | 9.42 | -0.32 |
| 6 | 8.20 | -1.54 |
| 7 | 9.08 | -0.66 |
| 8 | 11.52 | 1.78 |
| 9 | 9.87 | 0.13 |
| 10 | 11.04 | 1.30 |
---
## **In Conclusion:**
- Use least squares to find the best-fit line for your data.
- For stress-strain: plot and fit \(\sigma\) vs. \(\epsilon\).
- For modulus: plot and fit \(E\) vs. group number (or just take the mean if no trend).
- Draw your best-fit line and comment on how well the data fits.
If you have actual stress-strain data, I can show you how to do calculations and plotting in Excel or Python!
---
**Would you like a step-by-step numerical least squares example or a sample plot?**
📢 Instructions:
- Ask anything relatd to above question only.
- For new Question goto :