 VIPSolutions
Act like a helpful tutor and exlain me : how I can plot a graph using these information and the esteps to plug the number in the y axis and x axis in the grid paper.er Cea: n [EC vas) i250 58.1 Bale) = SEN ) cause
Question:
Act like a helpful tutor and exlain me :
how I can plot a graph using these information and the esteps to plug the number in the y axis and x axis in the grid paper.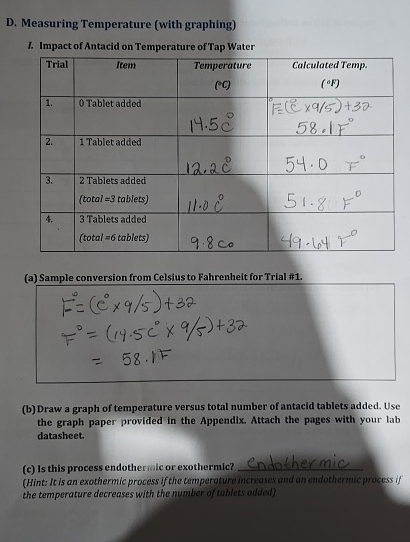 er
Cea:
n
[EC vas) i250
58.1
Bale)
= SEN
) cause
This is AI generated Response.
Asked by: Alok Kumar
Created at: 2026-02-02 05:47:35
Asked by: Alok Kumar
Created at: 2026-02-02 05:47:35
Final Answer:
Rendered
Raw Text
Did you like this answer?
# How to Plot a Graph Using Your Data
Let's break down the steps for plotting a graph of **temperature vs. total number of antacid tablets added** using the information in your worksheet.
---
## 1. **Identify Your Variables**
- **X-axis (horizontal):** Total number of antacid tablets added
(, 1, 3, 6)
- **Y-axis (vertical):** Temperature (°C or °F, but let's use °C as in your data)
---
## 2. **Prepare Your Grid Paper**
1. **Draw two perpendicular lines** to make your X and Y axes.
2. **Label your axes:**
- X-axis: "Total Number of Tablets"
- Y-axis: "Temperature (°C)"
---
## 3. **Mark the Axes with Values**
### **X-axis (Tablets)**
- Start at .
- Mark points for each data value: , 1, 3, 6.
- Space them evenly.
### **Y-axis (Temperature)**
- The temperature values range from about 9.8°C to 14.5°C.
- Start a little below 9.8°C (e.g., 9°C) and end a little above 14.5°C (e.g., 15°C).
- Mark evenly spaced intervals, like every 1°C.
---
## 4. **Plot Each Data Point**
From your table:
| Tablets Added | Temperature (°C) |
|---------------|------------------|
| | 14.5 |
| 1 | 12.2 |
| 3 | 11. |
| 6 | 9.8 |
- Find each x-value (tablets) on the horizontal axis.
- Find each y-value (temperature) on the vertical axis.
- Place a dot where the two values meet on the grid.
---
## 5. **Connect the Dots**
- Use a ruler to draw straight lines connecting each dot to the next in order.
- This will show how the temperature changes as more tablets are added.
---
## 6. **Title Your Graph**
- At the top, write a title like:
**"Effect of Antacid Tablets on Tap Water Temperature"**
---
## 7. **Example Layout**
Here’s a quick example of how your axes and first point might look:
```
Y-axis (Temp, °C)
^
|
| *
|
| *
|
| *
|____________________> X-axis (Total Tablets)
1 3 6
```
(Dots are just an illustration—your grid will be more precise!)
---
## 8. **Double-Check**
- Make sure your points match the data.
- Label both axes and the graph title.
---
### **Summary Table for Reference:**
| Total Tablets Added | Temperature (°C) |
|--------------------|------------------|
| | 14.5 |
| 1 | 12.2 |
| 3 | 11. |
| 6 | 9.8 |
---
If you have any questions about a step, feel free to ask!
📢 Instructions:
- Ask anything relatd to above question only.
- For new Question goto :