Act like a helpful tutor and exlain me :
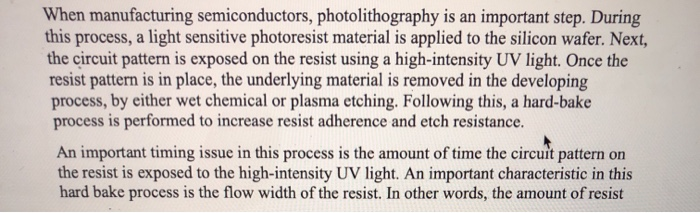
Give step-by-step solution with explanation and final answer:‘When manufacturing semiconductors, photolithography is an important step. During
this process, a light sensitive photoresist material is applied to the silicon wafer. Next,
the circuit pattern is exposed on the resist using a high-intensity UV light. Once the
resist pattern is in place, the underlying material is removed in the developing
‘process, by cither wet chemical or plasma etching. Following this, a hard-bake
process is performed to increase resist adherence and etch resistance.
An important timing issue in this process is the amount of time the circu pattern on
the resist is exposed to the high-intensity UV light. An important characteristic in this
‘hard bake process is the flow width of the resist. In other words, the amount of resist
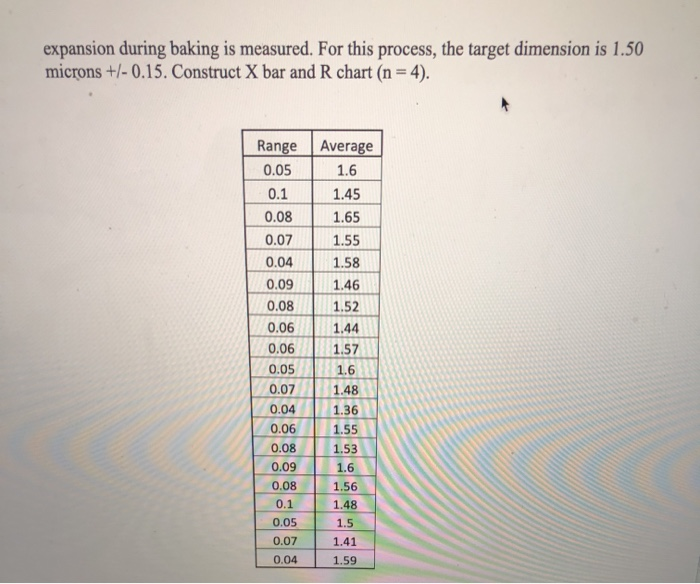
expansion during baking is measured. For this process, the target dimension is 1.5( }
‘microns +/- 0.15. Construct X bar and R chart (n =4). 3
i; 3
:
[Range [verse | ;
[00s | 16 | 1
E Cos [aes]
y ; | 00s | 165 | i
k | 00s | 158 |
i [ooo | as | r
E [006 | 14a] a
et i NNN
Z Joos [Tass | WN AAA
¢ oa [Tas \ Na
Ara TR NNN NAN \
[Foss [Taser] NAA
[or [Tim] NAA
[Loos "us AN NN
no | 1 |
Question:
Act like a helpful tutor and exlain me :
Give step-by-step solution with explanation and final answer:‘When manufacturing semiconductors, photolithography is an important step. During
this process, a light sensitive photoresist material is applied to the silicon wafer. Next,
the circuit pattern is exposed on the resist using a high-intensity UV light. Once the
resist pattern is in place, the underlying material is removed in the developing
‘process, by cither wet chemical or plasma etching. Following this, a hard-bake
process is performed to increase resist adherence and etch resistance.
An important timing issue in this process is the amount of time the circu pattern on
the resist is exposed to the high-intensity UV light. An important characteristic in this
‘hard bake process is the flow width of the resist. In other words, the amount of resist
expansion during baking is measured. For this process, the target dimension is 1.5( }
‘microns +/- 0.15. Construct X bar and R chart (n =4). 3
i; 3
:
[Range [verse | ;
[00s | 16 | 1
E Cos [aes]
y ; | 00s | 165 | i
k | 00s | 158 |
i [ooo | as | r
E [006 | 14a] a
et i NNN
Z Joos [Tass | WN AAA
¢ oa [Tas \ Na
Ara TR NNN NAN \
[Foss [Taser] NAA
[or [Tim] NAA
[Loos "us AN NN
no | 1 |
This is AI generated Response.
Asked by: Umesh
Created at: 2025-08-01 20:27:52
Final Answer:
RenderedRaw Text
Did you like this answer?
Let's walk through how to **construct an X-bar and R chart** step by step. This is a type of control chart used in quality control to monitor the mean and range of a process over time.
**Given:**
- The target dimension is 1.50 microns ± 0.15.
- You have a table of averages (X-bar) and ranges (R) for 20 samples (each sample presumably is a subgroup of 4, n=4).
---
### **Step 1: List the Data**
Let's write the data given:
| Range | Average |
|-------|---------|
| 0.05 | 1.60 |
| 0.10 | 1.45 |
| 0.08 | 1.65 |
| 0.07 | 1.55 |
| 0.04 | 1.58 |
| 0.09 | 1.46 |
| 0.08 | 1.52 |
| 0.06 | 1.44 |
| 0.06 | 1.57 |
| 0.05 | 1.60 |
| 0.07 | 1.48 |
| 0.04 | 1.36 |
| 0.06 | 1.55 |
| 0.09 | 1.60 |
| 0.08 | 1.56 |
| 0.10 | 1.48 |
| 0.07 | 1.41 |
| 0.04 | 1.59 |
---
### **Step 2: Calculate the Grand Average (X-double bar) and Average Range (R-bar)**
#### **X-double bar (Grand Average)**
\[
\overline{\overline{X}} = \frac{\sum \overline{X}}{k}
\]
Where \( k \) = number of samples.
Sum all "Average" values:
\[
\text{Sum of Averages} = 1.60 + 1.45 + 1.65 + 1.55 + 1.58 + 1.46 + 1.52 + 1.44 + 1.57 + 1.60 + 1.48 + 1.36 + 1.55 + 1.60 + 1.56 + 1.48 + 1.41 + 1.59
\]
\[
\text{Sum} = 28.55
\]
\[
k = 18
\]
\[
\overline{\overline{X}} = \frac{28.55}{18} = 1.586
\]
#### **R-bar (Average Range)**
\[
\overline{R} = \frac{\sum R}{k}
\]
Sum all "Range" values:
\[
\text{Sum of Ranges} = 0.05 + 0.10 + 0.08 + 0.07 + 0.04 + 0.09 + 0.08 + 0.06 + 0.06 + 0.05 + 0.07 + 0.04 + 0.06 + 0.09 + 0.08 + 0.10 + 0.07 + 0.04
\]
\[
\text{Sum} = 1.13
\]
\[
\overline{R} = \frac{1.13}{18} = 0.0628
\]
---
### **Step 3: Calculate Control Limits**
For \( n = 4 \), the control chart constants are:
- \( A_2 = 0.729 \)
- \( D_3 = 0 \)
- \( D_4 = 2.282 \)
#### **For X-bar Chart:**
\[
UCL_{X} = \overline{\overline{X}} + A_2 \overline{R}
\]
\[
LCL_{X} = \overline{\overline{X}} - A_2 \overline{R}
\]
Plug in values:
\[
UCL_{X} = 1.586 + 0.729 \times 0.0628 = 1.586 + 0.0458 = 1.6318
\]
\[
LCL_{X} = 1.586 - 0.0458 = 1.5402
\]
#### **For R Chart:**
\[
UCL_{R} = D_4 \overline{R}
\]
\[
LCL_{R} = D_3 \overline{R}
\]
Plug in values:
\[
UCL_{R} = 2.282 \times 0.0628 = 0.1433
\]
\[
LCL_{R} = 0 \times 0.0628 = 0
\]
---
### **Step 4: Final Answers**
**X-bar chart:**
- **Center Line (CL):** \( 1.586 \)
- **UCL:** \( 1.632 \) (rounded)
- **LCL:** \( 1.540 \) (rounded)
**R chart:**
- **Center Line (CL):** \( 0.063 \) (rounded)
- **UCL:** \( 0.143 \)
- **LCL:** \( 0 \)
---
### **Summary Table**
| Chart | Center Line | UCL | LCL |
|--------|-------------|--------|--------|
| X-bar | 1.586 | 1.632 | 1.540 |
| R | 0.063 | 0.143 | 0 |
---
**You can now plot the X-bar and R values from the table above against these control limits to monitor your process!**
If you need help with plotting or interpreting, let me know!
VIPSolutions focuses on clear, step‑by‑step explanations so you can learn quickly. Whether you need an AI‑generated walkthrough or a short hint to get unstuck, each solution is organized for fast reading and easy review later.
Search similar questions, compare approaches, and bookmark the best answers for revision. Our goal is simple: quick, reliable study help that feels natural—not noisy.
 VIPSolutions
 ‘When manufacturing semiconductors, photolithography is an important step. During
this process, a light sensitive photoresist material is applied to the silicon wafer. Next,
the circuit pattern is exposed on the resist using a high-intensity UV light. Once the
resist pattern is in place, the underlying material is removed in the developing
‘process, by cither wet chemical or plasma etching. Following this, a hard-bake
process is performed to increase resist adherence and etch resistance.
An important timing issue in this process is the amount of time the circu pattern on
the resist is exposed to the high-intensity UV light. An important characteristic in this
‘hard bake process is the flow width of the resist. In other words, the amount of resist
expansion during baking is measured. For this process, the target dimension is 1.5( }
‘microns +/- 0.15. Construct X bar and R chart (n =4). 3
i; 3
:
[Range [verse | ;
[00s | 16 | 1
E Cos [aes]
y ; | 00s | 165 | i
k | 00s | 158 |
i [ooo | as | r
E [006 | 14a] a
et i NNN
Z Joos [Tass | WN AAA
¢ oa [Tas \ Na
Ara TR NNN NAN \
[Foss [Taser] NAA
[or [Tim] NAA
[Loos "us AN NN
no | 1 |