 VIPSolutions
Act like a helpful tutor and exlain me :Concentration and time data were collected for A —> products Enter the data into the graphing tool and identify the eo | reaction order. Graphing Tool [Alvs. t In[A] vs. t t [A] In[A] 1/[A] = |
Question:
Act like a helpful tutor and exlain me :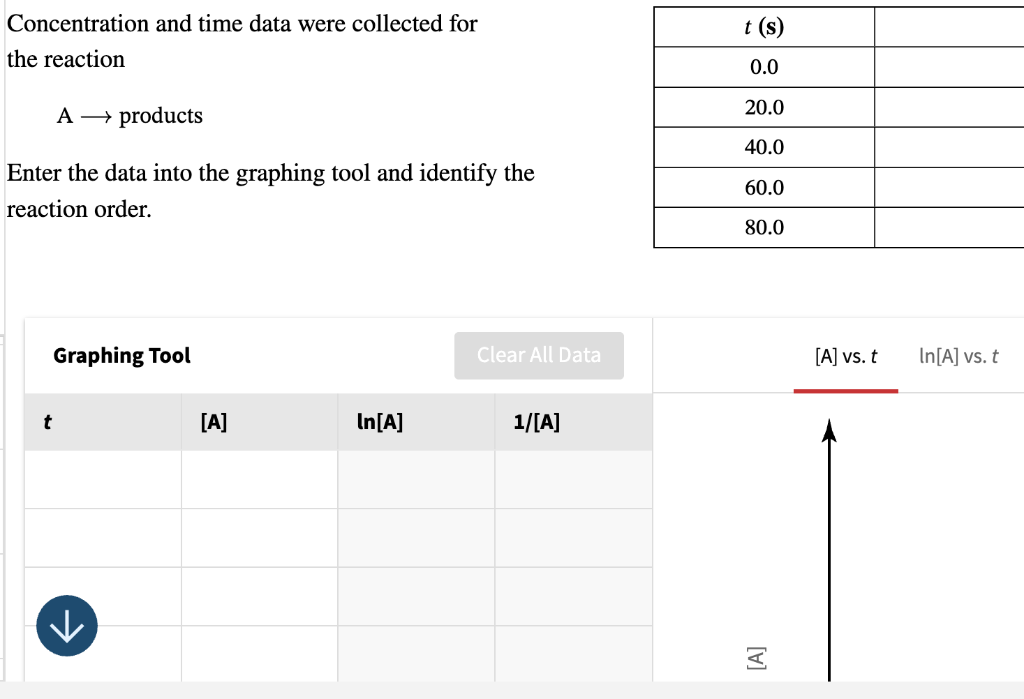 Concentration and time data were collected for
A —> products
Enter the data into the graphing tool and identify the eo |
reaction order.
Graphing Tool [Alvs. t In[A] vs. t
t [A] In[A] 1/[A]
= |
This is AI generated Response.
Asked by: Alok Kumar
Created at: 2026-03-02 06:19:52
Asked by: Alok Kumar
Created at: 2026-03-02 06:19:52
Final Answer:
Rendered
Raw Text
Did you like this answer?
Absolutely! Let’s break down **how to identify the order of a reaction** using concentration and time data.
---
## **Step-by-Step Explanation**
### **1. The Reaction**
You are studying the reaction:
\[ \text{A} \rightarrow \text{products} \]
### **2. Data Collected**
You have time (\( t \)) and concentration (\([A]\)) data (though \([A]\) values are not shown in your screenshot, you would enter them).
### **3. How to Determine the Reaction Order**
You’ll need to determine if the reaction is **zero**, **first**, or **second order** with respect to A.
Each order gives a different relationship between concentration and time:
#### **a. Zero Order**
- **Integrated Rate Law:** \([A] = [A]_ - kt\)
- **Plot:** \([A]\) vs. \( t \)
If this plot is linear (straight line), the reaction is zero order.
#### **b. First Order**
- **Integrated Rate Law:** \(\ln[A] = \ln[A]_ - kt\)
- **Plot:** \(\ln[A]\) vs. \( t \)
If this plot is linear, the reaction is first order.
#### **c. Second Order**
- **Integrated Rate Law:** \(\frac{1}{[A]} = \frac{1}{[A]_} + kt\)
- **Plot:** \(\frac{1}{[A]}\) vs. \( t \)
If this plot is linear, the reaction is second order.
---
### **4. How to Use the Graphing Tool**
1. **Enter your data** for time (\( t \)) and concentration (\([A]\)) in the table.
2. **The tool will calculate** \(\ln[A]\) and \(1/[A]\) for you.
3. **Make three plots:**
- \([A]\) vs. \( t \)
- \(\ln[A]\) vs. \( t \)
- \(1/[A]\) vs. \( t \)
4. **Look for the straight line:**
- The plot that gives you a straight line tells you the order!
---
### **Summary Table**
| **Order** | **Plot Linear?** | **What to plot** |
|-----------|---------------------|-----------------------|
| Zero | [A] vs. t | [A] vs. t |
| First | ln[A] vs. t | ln[A] vs. t |
| Second | 1/[A] vs. t | 1/[A] vs. t |
---
### **Next Steps**
- Enter your \([A]\) data.
- Make the three plots.
- **Identify which plot is linear**—that's your reaction order!
---
**Let me know if you want to see an example with numbers, or if you have your concentration data ready!**
📢 Instructions:
- Ask anything relatd to above question only.
- For new Question goto :