A manufacturing unit operates on a monthly production cycle to produce a single standardized product. Demand is steady throughout the year, and inventory is maintained to ensure uninterrupted production and dispatch. The management is reviewing its current inventory strategy and exploring ways to reduce total costs through optimized ordering, storage, and scheduling processes. Raw materials are procured in batches. The supplier delivers materials \( \mathbf{4} \) working days after an order is placed. There are \( \mathbf{2 5} \) working days in a month. All units produced are sold, and there is no backlog. The management wants to determine optimal inventory and ordering levels to minimize the combined cost of ordering and holding. Below is the available data: REQUIRED: (A) Using the EOQ model, calculate the Economic Order Quantity (EOQ). (Provide the formula and show all steps.) (B) Based on the EOQ, determine: i) Number of orders placed annually ii) Total annual ordering cost (C) Compute the following: i) Average inventory held ii) Total annual holding cost (D) Calculate the Reorder Point (ROP), assuming uniform daily demand and a 4-day lead time. (E) Draw a flowchart representing the end-to-end production and inventory process. The flowchart should include the following stages, in sequence: Raw Material Ordering Supplier Delivery Raw Material Storage Production Process In-Process Quality Check Finished Goods Storage Dispatch to CustomerA manufacturing unit operates on a monthly production cycle to produce a single standardized product.
Demand is steady throughout the year, and inventory is maintained to ensure uninterrupted production and
dispatch. The management is reviewing its current inventory strategy and exploring ways to reduce total costs
through optimized ordering, storage, and scheduling processes.
Raw materials are procured in batches. The supplier delivers materials 4 working days after an order is placed.
There are 25 working days in a month. All units produced are sold, and there is no backlog. The
management wants to determine optimal inventory and ordering levels to minimize the combined cost of
ordering and holding.
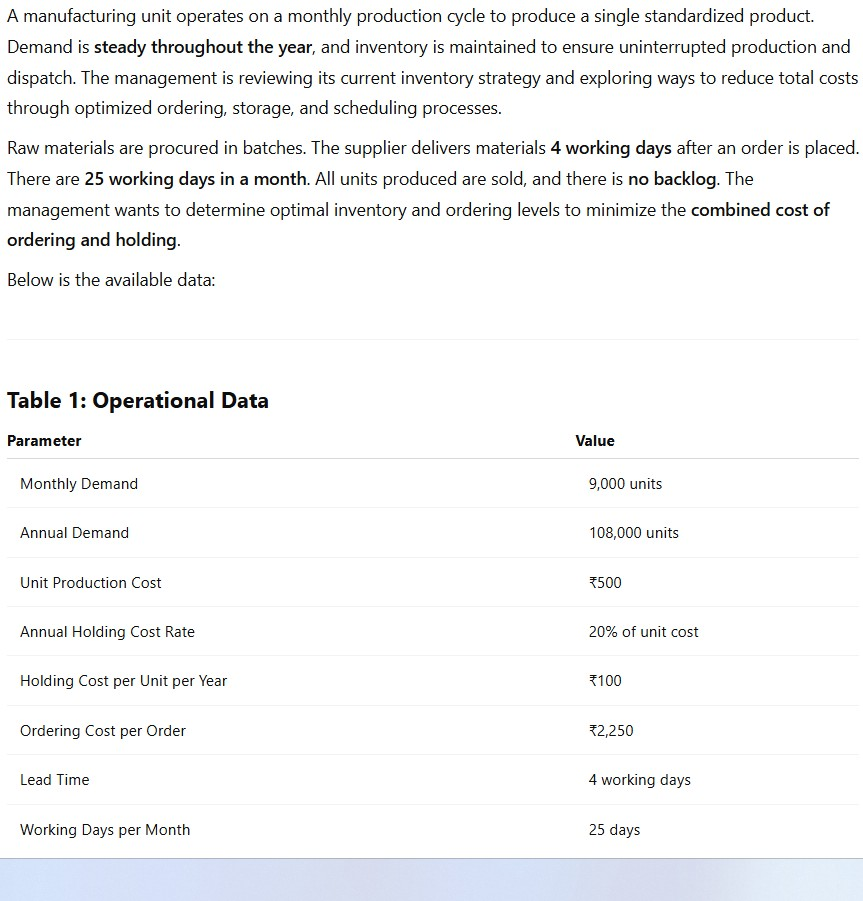
Below is the available data:
Table 1: Operational Data
Parameter Value
Monthly Demand 9,000 units
Annual Demand 108,000 units
Unit Production Cost 2500
Annual Holding Cost Rate 20% of unit cost
Holding Cost per Unit per Year 100
Ordering Cost per Order 2250
Lead Time 4 working days
Working Days per Month 25 days
Question:
A manufacturing unit operates on a monthly production cycle to produce a single standardized product. Demand is steady throughout the year, and inventory is maintained to ensure uninterrupted production and dispatch. The management is reviewing its current inventory strategy and exploring ways to reduce total costs through optimized ordering, storage, and scheduling processes. Raw materials are procured in batches. The supplier delivers materials \( \mathbf{4} \) working days after an order is placed. There are \( \mathbf{2 5} \) working days in a month. All units produced are sold, and there is no backlog. The management wants to determine optimal inventory and ordering levels to minimize the combined cost of ordering and holding. Below is the available data: REQUIRED: (A) Using the EOQ model, calculate the Economic Order Quantity (EOQ). (Provide the formula and show all steps.) (B) Based on the EOQ, determine: i) Number of orders placed annually ii) Total annual ordering cost (C) Compute the following: i) Average inventory held ii) Total annual holding cost (D) Calculate the Reorder Point (ROP), assuming uniform daily demand and a 4-day lead time. (E) Draw a flowchart representing the end-to-end production and inventory process. The flowchart should include the following stages, in sequence: Raw Material Ordering Supplier Delivery Raw Material Storage Production Process In-Process Quality Check Finished Goods Storage Dispatch to CustomerA manufacturing unit operates on a monthly production cycle to produce a single standardized product.
Demand is steady throughout the year, and inventory is maintained to ensure uninterrupted production and
dispatch. The management is reviewing its current inventory strategy and exploring ways to reduce total costs
through optimized ordering, storage, and scheduling processes.
Raw materials are procured in batches. The supplier delivers materials 4 working days after an order is placed.
There are 25 working days in a month. All units produced are sold, and there is no backlog. The
management wants to determine optimal inventory and ordering levels to minimize the combined cost of
ordering and holding.
Below is the available data:
Table 1: Operational Data
Parameter Value
Monthly Demand 9,000 units
Annual Demand 108,000 units
Unit Production Cost 2500
Annual Holding Cost Rate 20% of unit cost
Holding Cost per Unit per Year 100
Ordering Cost per Order 2250
Lead Time 4 working days
Working Days per Month 25 days
This is AI generated Response.
Asked by: chandu
Created at: 2026-03-04 03:21:46
Thought Process:
RenderedRaw Text
**Calculating EOQ**
I need to analyze the provided data, which includes monthly demand, annual demand, production costs, and holding and ordering costs. I’ll compute the Economic Order Quantity (EOQ) using the formula EOQ = sqrt(2DS/H), where D is annual demand, S is ordering cost, and H is holding cost. After a few calculations, I realize I have the right approach but let’s ensure accuracy in these numbers for precise EOQ. This could take a moment!**Calculating EOQ and Orders**
Alright, I’ve found that the EOQ is around 2,205 units, which is good! Now I want to calculate the number of orders placed annually by dividing the annual demand by the EOQ. That gives me about 49 orders per year. Sometimes they keep decimals, so that's interesting. Also, considering cycle time, there are about 300 working days in a year, and I could calculate the average time between orders, but that’s not asked—just a nice extra insight!**Precision in Calculations**
I’m diving into the calculations to be as precise as possible. So, 108,000 divided by 2,204.54 gives me approximately 49.0, confirming my earlier estimates about the number of orders. However, to fine-tune this, I can also say that 48.98 orders is accurate. The total ordering cost comes out to around ₹110,205. It’s interesting to note that at EOQ, the ordering and holding costs are equal, which links back to my understanding of total costs in inventory management. I think I'm making good progress!**Understanding EOQ Components**
At the Economic Order Quantity (EOQ), the ordering cost and holding cost must equal each other, which is really interesting! When I compute the ordering cost formula at EOQ, I find that it simplifies nicely to sqrt(DSH/2). For the holding cost, it also leads to the same value. This confirms that both costs converge at EOQ. It’s such a neat relationship, and I feel like it helps solidify my understanding of how these variables interact in inventory management!**Computing EOQ and Additional Costs**
I’m running a detailed computation for EOQ and related costs. First, I’ll calculate D (annual demand), S (ordering cost), and H (holding cost). After some calculations, I find that when I compute the ordering cost, it's approximately ₹110,227, which is consistent with previous findings around ₹110,205.
Next, I’ll break down the steps to present: EOQ formula, total annual ordering cost, average inventory, and reorder point. I’ll also create an ASCII flowchart to visualize the production and inventory process, ensuring everything's clear and organized!**Finalizing the Answer Structure**
The user wants all steps and formulas clearly shown, so I'll make sure to include everything neatly. I can also compute the total annual variable cost at EOQ, which is about ₹220,500, but since that wasn't specifically requested, I might include it as an optional detail. I’ll organize the final answers into sections labeled A to E, checking that the reorder point (ROP) correctly triggers orders for the EOQ quantity. Keeping formatting simple, I'll use bullet points and include rupee symbols for clarity. Let's get this final structure ready!
Final Answer:
RenderedRaw Text
Did you like this answer?
Here is the EOQ-based solution using the data provided.
Given
- Monthly demand = 9,000 units
- Annual demand, D = 108,000 units
- Unit production (purchase) cost = ₹500
- Annual holding-cost rate = 20% of unit cost
- Holding cost per unit per year, H = 0.20 × 500 = ₹100
- Ordering cost per order, S = ₹2,250
- Lead time = 4 working days
- Working days per month = 25 → 300 working days per year
A) Economic Order Quantity (EOQ)
Formula: EOQ = sqrt( (2 × D × S) / H )
Step-by-step:
- 2 × D × S = 2 × 108,000 × 2,250 = 486,000,000
- Divide by H: 486,000,000 / 100 = 4,860,000
- Square root: EOQ = sqrt(4,860,000) ≈ 2,204.5 units
Answer: EOQ ≈ 2,205 units (rounded to the nearest unit)
B) Based on EOQ
i) Number of orders placed annually
N = D / EOQ = 108,000 / 2,205 ≈ 48.98 ≈ 49 orders per year
(Equivalent timing ≈ 300 working days / 49 ≈ 6.1 working days between orders)
ii) Total annual ordering cost
Ordering cost = N × S = (108,000 / 2,205) × 2,250 ≈ ₹110,200–₹110,250
(At EOQ, ordering cost equals holding cost; both are about ₹110,250 with rounding.)
C) Inventory and holding cost
i) Average inventory held
Average inventory = EOQ / 2 = 2,205 / 2 = 1,102.5 units
ii) Total annual holding cost
Holding cost = H × (EOQ / 2) = 100 × 1,102.5 = ₹110,250
D) Reorder Point (ROP)
Daily demand = Annual demand / working days per year = 108,000 / 300 = 360 units/day
Lead time = 4 working days
ROP = daily demand × lead time = 360 × 4 = 1,440 units
(With no variability assumed, safety stock = 0; ROP = 1,440 units.)
E) Flowchart of production and inventory process
- Start
- Monitor raw-material inventory daily
- If On-hand ≤ ROP (1,440 units), place a purchase order for EOQ (2,205 units)
- Raw Material Ordering
- Supplier Delivery (arrives after 4 working days)
- Raw Material Storage (receive, check, and store)
- Production Process (issue materials to production)
- In-Process Quality Check (inspect WIP, rework/reject as needed)
- Finished Goods Storage (store approved finished goods)
- Dispatch to Customer (ship against steady demand)
- Update records (inventory balances, next ROP check, costs)
- Loop back to “Monitor raw-material inventory daily”
Key results (rounded):
- EOQ: 2,205 units
- Orders per year: ≈ 49
- Annual ordering cost: ≈ ₹110,250
- Average inventory: 1,102.5 units
- Annual holding cost: ≈ ₹110,250
- ROP: 1,440 units
These settings minimize the combined ordering and holding costs under the given assumptions (steady demand, instantaneous replenishment, no shortages).
Question:
Flowchart of production and inventory process improve
This is AI generated Response.
Asked by: chandu
Created at: 2026-03-04 03:27:00
Final Answer:
RenderedRaw Text
Did you like this answer?
# Flowchart of Production and Inventory Process
The flowchart below outlines the key stages in the production and inventory process for a manufacturing unit. Each step is essential for maintaining an efficient production cycle while managing inventory effectively.
## Flowchart Stages
1. **Monitor Raw Material Inventory Daily**
- Continuously check stock levels against the Reorder Point (ROP).
2. **Check Inventory Level**
- If On-hand Inventory ≤ ROP (1,440 units):
- Proceed to place an order.
3. **Raw Material Ordering**
- Place an order for the Economic Order Quantity (EOQ) of 2,205 units.
4. **Supplier Delivery**
- Await delivery of raw materials, which takes 4 working days.
5. **Raw Material Storage**
- Receive and inspect materials upon arrival.
- Store materials in the designated area.
6. **Production Process**
- Issue raw materials to the production line as needed.
- Begin the manufacturing process.
7. **In-Process Quality Check**
- Conduct quality checks on work-in-progress (WIP).
- Rework or reject items that do not meet quality standards.
8. **Finished Goods Storage**
- Store finished goods in the inventory after quality inspection.
9. **Dispatch to Customer**
- Ship finished goods as per customer demand.
10. **Update Records**
- Record updates on inventory levels, costs, and next ROP check.
11. **Loop Back**
- Return to the first step to monitor raw material inventory daily.
## Visual Representation
*Alt text: Flowchart illustrating the production and inventory process, detailing stages from raw material ordering to dispatching finished goods.*
By following this structured process, the manufacturing unit can optimize its inventory management and production efficiency, ensuring timely delivery and reducing costs.
VIPSolutions focuses on clear, step‑by‑step explanations so you can learn quickly. Whether you need an AI‑generated walkthrough or a short hint to get unstuck, each solution is organized for fast reading and easy review later.
Search similar questions, compare approaches, and bookmark the best answers for revision. Our goal is simple: quick, reliable study help that feels natural—not noisy.
 VIPSolutions
 A manufacturing unit operates on a monthly production cycle to produce a single standardized product.
Demand is steady throughout the year, and inventory is maintained to ensure uninterrupted production and
dispatch. The management is reviewing its current inventory strategy and exploring ways to reduce total costs
through optimized ordering, storage, and scheduling processes.
Raw materials are procured in batches. The supplier delivers materials 4 working days after an order is placed.
There are 25 working days in a month. All units produced are sold, and there is no backlog. The
management wants to determine optimal inventory and ordering levels to minimize the combined cost of
ordering and holding.
Below is the available data:
Table 1: Operational Data
Parameter Value
Monthly Demand 9,000 units
Annual Demand 108,000 units
Unit Production Cost 2500
Annual Holding Cost Rate 20% of unit cost
Holding Cost per Unit per Year 100
Ordering Cost per Order 2250
Lead Time 4 working days
Working Days per Month 25 days