 VIPSolutions
Use six rectangles to find an estimate of each type for the area under the given graph of f from = 0 tor =12. Ld un 2 1. Take the sample points from the left-endpoints. Answer: Lg iy) 2. Is your estimate Lg an underestimate or overestimate of the true wes Croeseone +) 3. Take the sample points from the right-endpoints. Plas 4. Is your estimate Rg an underestimate or overestimate of the true ses Crease one +) 5. Take the sample points from the midpoints. Answer: My ig
Question:
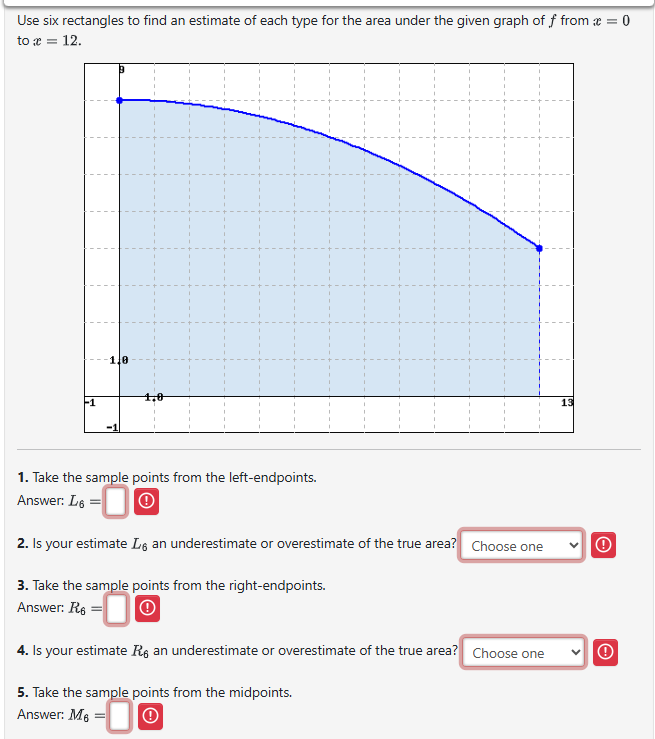 Use six rectangles to find an estimate of each type for the area under the given graph of f from = 0
tor =12.
Ld un
2
1. Take the sample points from the left-endpoints.
Answer: Lg iy)
2. Is your estimate Lg an underestimate or overestimate of the true wes Croeseone +)
3. Take the sample points from the right-endpoints.
Plas
4. Is your estimate Rg an underestimate or overestimate of the true ses Crease one +)
5. Take the sample points from the midpoints.
Answer: My ig
This is AI generated Response.
Asked by: MANCHALA TEJA
Created at: 2025-07-18 01:31:48
Asked by: MANCHALA TEJA
Created at: 2025-07-18 01:31:48
Final Answer:
Rendered
Raw Text
Did you like this answer?
Let's break down the problem step by step:
### 1. **Left Endpoint Estimate (\(L_6\))**
- The interval is from \( x=0 \) to \( x=12 \), split into 6 rectangles, so each rectangle has a width of \( \Delta x = \frac{12-0}{6} = 2 \).
- The left endpoints are: \( x = 0, 2, 4, 6, 8, 10 \).
From the graph, let's estimate the \( y \)-values at these points:
- \( f(0) \approx 2 \)
- \( f(2) \approx 2 \)
- \( f(4) \approx 1.8 \)
- \( f(6) \approx 1.5 \)
- \( f(8) \approx 1.1 \)
- \( f(10) \approx 0.6 \)
Calculate \( L_6 \):
\[
L_6 = 2 \left[ f(0) + f(2) + f(4) + f(6) + f(8) + f(10) \right]
\]
\[
L_6 = 2 [2 + 2 + 1.8 + 1.5 + 1.1 + 0.6] = 2 \times 9 = 18
\]
### 2. **Underestimate or Overestimate?**
Since the function is **decreasing**, the left endpoint approximation will be an **overestimate** (the rectangles overshoot the curve on the right side).
---
### 3. **Right Endpoint Estimate (\(R_6\))**
The right endpoints are: \( x = 2, 4, 6, 8, 10, 12 \).
Estimated \( y \)-values:
- \( f(2) \approx 2 \)
- \( f(4) \approx 1.8 \)
- \( f(6) \approx 1.5 \)
- \( f(8) \approx 1.1 \)
- \( f(10) \approx 0.6 \)
- \( f(12) \approx 0 \)
Calculate \( R_6 \):
\[
R_6 = 2 [2 + 1.8 + 1.5 + 1.1 + 0.6 + 0] = 2 \times 7 = 14
\]
### 4. **Underestimate or Overestimate?**
Since the function is **decreasing**, the right endpoint approximation will be an **underestimate** (the rectangles undershoot the curve on the left side).
---
### 5. **Midpoint Estimate (\(M_6\))**
The midpoints are: \( x = 1, 3, 5, 7, 9, 11 \).
Estimated \( y \)-values:
- \( f(1) \approx 2 \)
- \( f(3) \approx 1.9 \)
- \( f(5) \approx 1.65 \)
- \( f(7) \approx 1.3 \)
- \( f(9) \approx 0.85 \)
- \( f(11) \approx 0.3 \)
Calculate \( M_6 \):
\[
M_6 = 2 [2 + 1.9 + 1.65 + 1.3 + 0.85 + 0.3] = 2 \times 8 = 16
\]
---
## **Summary of Answers:**
1. \( L_6 = 18 \)
2. Overestimate
3. \( R_6 = 14 \)
4. Underestimate
5. \( M_6 = 16 \)
Let me know if you want a more precise estimate for the values!
📢 Instructions:
- Ask anything relatd to above question only.
- For new Question goto :