 VIPSolutions
period. That is, the option is to reduce income next year by \( x \) units and increase the income in the current period by \(x\). [1]. [a] Using a diagram, illustrate why the employee would take this option. [1]. [b] Determine, using a diagram, how this shift in income will affect consumption this year and next year. What will happen to current savings of this individual? Explain your results. [1] An employer offers an employee the option of shifting x units of income from the future increase the income mn the current period by x [1)-a] Using a diagram. illustrate why the employee would take this option. tn WES, AN Eopgot Samaa age of os APE Expl gone.
Question:
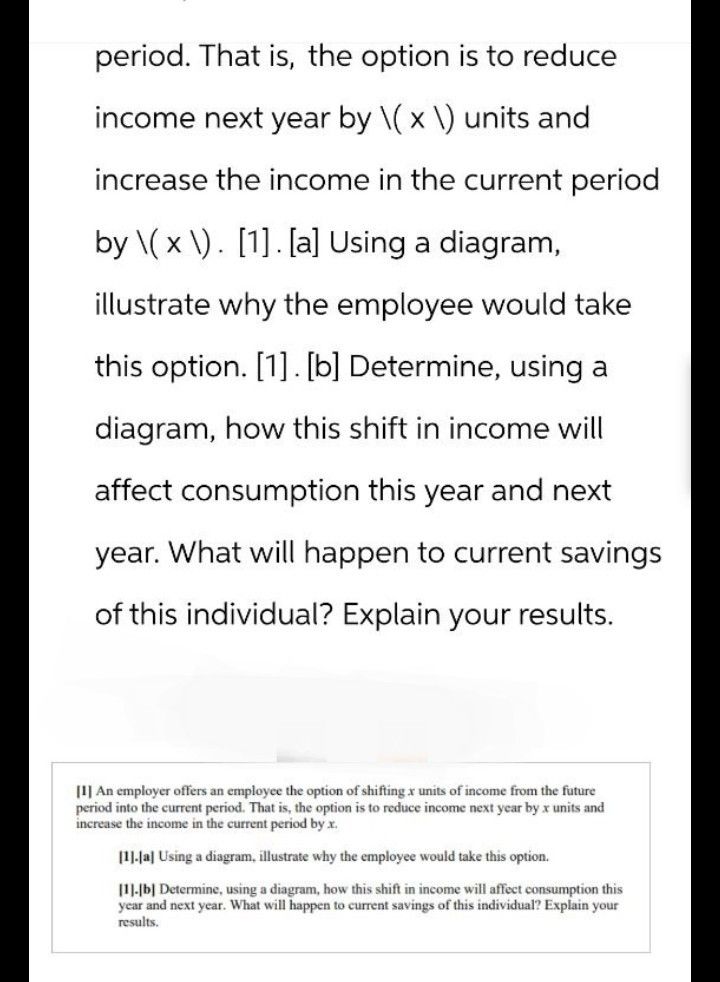 period. That is, the option is to reduce
income next year by \( x \) units and
increase the income in the current period
by \(x\). [1]. [a] Using a diagram,
illustrate why the employee would take
this option. [1]. [b] Determine, using a
diagram, how this shift in income will
affect consumption this year and next
year. What will happen to current savings
of this individual? Explain your results.
[1] An employer offers an employee the option of shifting x units of income from the future
increase the income mn the current period by x
[1)-a] Using a diagram. illustrate why the employee would take this option.
tn WES, AN Eopgot Samaa age of os APE Expl gone.
This is AI generated Response.
Asked by: Vikram Kumar
Created at: 2025-09-20 02:20:42
Asked by: Vikram Kumar
Created at: 2025-09-20 02:20:42
Final Answer:
Rendered
Raw Text
Did you like this answer?
# Intertemporal Choice: Income Shifting
## Problem Summary
An employee can **shift \( x \) units of income** from next year to the current year, increasing current income by \( x \) but reducing next year's income by \( x \).
---
## [1].a **Why Would the Employee Take This Option?**
### **Diagram Explanation**
- **Axes:**
- **X-axis:** Consumption this year (\( C_1 \))
- **Y-axis:** Consumption next year (\( C_2 \))
- **Budget Constraint:**
- **Original constraint:** \( C_1 + \frac{C_2}{1+r} = Y_1 + \frac{Y_2}{1+r} \)
- **After shifting \( x \):**
- Current income increases by \( x \): \( Y_1 + x \)
- Future income decreases by \( x \): \( Y_2 - x \)
- New constraint: \( C_1 + \frac{C_2}{1+r} = (Y_1 + x) + \frac{(Y_2 - x)}{1+r} \)
- **Indifference Curves:**
- Employee chooses the point that gives the highest utility (tangent to the budget line).
**Why shift?**
- If the employee prefers more consumption now (higher marginal utility from current consumption), shifting income forward allows them to better smooth consumption or meet urgent needs.
---
## [1].b **How Does This Affect Consumption and Savings?**
### **Diagram Description**
- **Show two budget lines:**
- Original budget line.
- New budget line after shifting \( x \).
- The new line pivots outward for \( C_1 \) (current consumption) and inward for \( C_2 \) (future consumption).
#### **Effects:**
- **Consumption This Year (\( C_1 \)):** Increases.
- **Consumption Next Year (\( C_2 \)):** Decreases.
- **Current Savings:**
- **Savings = Income - Consumption.**
- As current income rises and current consumption rises (potentially by less than \( x \)), **current savings may decrease**.
### **Explanation:**
- The shift allows the employee to transfer resources to the period where they value consumption more.
- The individual will re-optimize consumption across the two periods, likely increasing current consumption and reducing future consumption.
- If the individual consumes all of the increased income, savings drop by \( x \). If they save part of it, the drop in savings is less than \( x \).
---
## **Summary Table**
| Period | Income Change | Consumption Change | Savings Change |
|--------------------|--------------|-------------------|-----------------------|
| Current (Year 1) | +\( x \) | Increase | Likely decreases |
| Next (Year 2) | \(-x\) | Decrease | Future savings adjust |
---
## **Key Takeaways**
- The employee will opt to shift income if it increases their overall utility.
- This raises current consumption and lowers future consumption.
- **Current savings are likely to decrease** because more income is being spent now rather than saved for the future.
---
### **Simple Diagram Illustration (Text-based)**
```
C2 |
| / (new budget line, after shifting x)
| /
| /
|______/
C1
```
- The new budget line allows more \( C_1 \) at the expense of \( C_2 \).
---
Let me know if you need a more detailed diagram or a specific mathematical example!
📢 Instructions:
- Ask anything relatd to above question only.
- For new Question goto :