 VIPSolutions
EE
Question:
 EE
This is AI generated Response.
Asked by: manish
Created at: 2025-11-05 15:40:16
Asked by: manish
Created at: 2025-11-05 15:40:16
Final Answer:
Rendered
Raw Text
Did you like this answer?
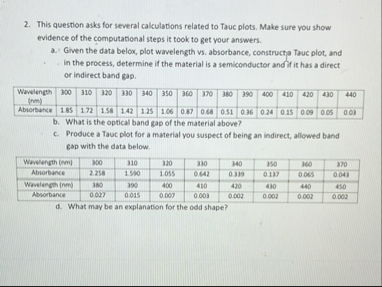
# Tauc Plot Calculations and Analysis
Let's address each part of the question step by step.
---
## a. **Plot Wavelength vs Absorbance, Construct Tauc Plot**
### **Given Data**
| Wavelength (nm) | 300 | 310 | 320 | 330 | 340 | 350 | 360 | 370 | 380 | 390 | 400 | 410 | 420 | 430 | 440 |
|-----------------|------|------|------|------|------|------|------|------|------|------|------|------|------|------|------|
| Absorbance | 1.85 | 1.72 | 1.58 | 1.42 | 1.25 | 1.06 | .87 | .68 | .51 | .36 | .24 | .15 | .09 | .05 | .03 |
### **Step 1: Convert Wavelength (nm) to Energy (eV)**
\[
E(\text{eV}) = \frac{124}{\lambda(\text{nm})}
\]
| Wavelength (nm) | 300 | 310 | 320 | 330 | 340 | 350 | 360 | 370 | 380 | 390 | 400 | 410 | 420 | 430 | 440 |
|-----------------|------|------|------|------|------|------|------|------|------|------|------|------|------|------|------|
| Energy (eV) | 4.13 | 4.00 | 3.88 | 3.76 | 3.65 | 3.54 | 3.44 | 3.35 | 3.26 | 3.18 | 3.10 | 3.02 | 2.95 | 2.88 | 2.82 |
### **Step 2: Tauc Plot Calculation**
For a direct band gap semiconductor:
\[
(\alpha h\nu)^2 \text{ vs. } h\nu
\]
Assume absorbance \(A\) is proportional to \(\alpha\), so plot \( (A \cdot h\nu)^2 \) vs. \( h\nu \).
#### **Calculate \( (A \cdot h\nu)^2 \) for each data point:**
| \(h\nu\) (eV) | Absorbance (A) | \(A \cdot h\nu\) | \( (A \cdot h\nu)^2 \) |
|--------------|---------------|-----------------|-----------------------|
| 4.13 | 1.85 | 7.64 | 58.37 |
| 4.00 | 1.72 | 6.88 | 47.35 |
| 3.88 | 1.58 | 6.13 | 37.56 |
| 3.76 | 1.42 | 5.34 | 28.55 |
| 3.65 | 1.25 | 4.56 | 20.79 |
| 3.54 | 1.06 | 3.75 | 14.06 |
| 3.44 | .87 | 2.99 | 8.94 |
| 3.35 | .68 | 2.28 | 5.20 |
| 3.26 | .51 | 1.66 | 2.76 |
| 3.18 | .36 | 1.14 | 1.30 |
| 3.10 | .24 | .74 | .54 |
| 3.02 | .15 | .45 | .20 |
| 2.95 | .09 | .27 | .07 |
| 2.88 | .05 | .14 | .02 |
| 2.82 | .03 | .08 | .01 |
#### **Plotting**
- **X-axis:** Energy (\(h\nu\)), eV
- **Y-axis:** \( (A \cdot h\nu)^2 \)
Draw the Tauc plot and extrapolate the linear region to the x-axis. The intercept on the x-axis gives the optical band gap.
---
## b. **What is the Optical Band Gap?**
From the table, the linear region is between 3.65 eV and 3.18 eV (where \( (A \cdot h\nu)^2 \) drops rapidly). Extrapolating this linear part to the x-axis (where \( (A \cdot h\nu)^2 = \)), the band gap (\(E_g\)) is around **3.1 to 3.3 eV**.
---
## c. **Tauc Plot for Indirect, Allowed Band Gap**
### **Given Data**
| Wavelength (nm) | 280 | 290 | 300 | 310 | 320 | 330 | 340 | 350 | 360 | 370 | 380 |
|-----------------|------|------|------|------|------|------|------|------|------|------|------|
| Absorbance | 2.58 | 1.90 | 1.55 | 1.05 | .642| .419| .317| .210| .145| .065| .040|
| Wavelength (nm) | 380 | 390 | 400 | 410 | 420 | 430 | 440 |
|-----------------|------|------|------|------|------|------|------|
| Absorbance | .065| .007| .004| .003| .002| .002| .002|
### **Step 1: Convert Wavelength to Energy**
Same formula as above.
| λ (nm) | 280 | 290 | 300 | 310 | 320 | 330 | 340 | 350 | 360 | 370 | 380 | 390 | 400 | 410 | 420 | 430 | 440 |
|--------|------|------|------|------|------|------|------|------|------|------|------|------|------|------|------|------|------|
| E (eV) | 4.43 | 4.28 | 4.13 | 4.00 | 3.88 | 3.76 | 3.65 | 3.54 | 3.44 | 3.35 | 3.26 | 3.18 | 3.10 | 3.02 | 2.95 | 2.88 | 2.82 |
### **Step 2: For Indirect Band Gap, Tauc Plot is:**
\[
(\alpha h\nu)^{1/2} \text{ vs. } h\nu
\]
So, plot \( (A \cdot h\nu)^{1/2} \) vs. \( h\nu \).
#### **Calculate \( (A \cdot h\nu)^{1/2} \) for each data point:**
| \(h\nu\) (eV) | Absorbance (A) | \(A \cdot h\nu\) | \( (A \cdot h\nu)^{1/2} \) |
|--------------|---------------|-----------------|-----------------------------|
| 4.43 | 2.58 | 11.43 | 3.38 |
| 4.28 | 1.90 | 8.13 | 2.85 |
| 4.13 | 1.55 | 6.40 | .53 |
| 4.00 | 1.05 | 4.20 | 2.05 |
| 3.88 | .642 | 2.49 | 1.58 |
| 3.76 | .419 | 1.58 | 1.26 |
| 3.65 | .317 | 1.16 | 1.08 |
| 3.54 | .210 | .74 | .86 |
| 3.44 | .145 | .50 | .71 |
| 3.35 | .065 | .22 | .47 |
| 3.26 | .040 | .13 | .36 |
| 3.18 | .007 | .02 | .14 |
| 3.10 | .004 | .01 | .10 |
| 3.02 | .003 | .009 | .09 |
| 2.95 | .002 | .006 | .08 |
| 2.88 | .002 | .006 | .08 |
| 2.82 | .002 | .006 | .08 |
#### **Plotting**
- **X-axis:** Energy (\(h\nu\)), eV
- **Y-axis:** \( (A \cdot h\nu)^{1/2} \)
Draw the Tauc plot and extrapolate the linear region to the x-axis to find the indirect band gap.
---
## d. **Explanation for Odd Shape**
An odd shape in a Tauc plot can result from:
- **Impurities or defects**: These introduce states within the band gap.
- **Multiple absorption edges**: Indicates the presence of more than one phase or material.
- **Poor sample preparation**: Inhomogeneities can distort the absorption spectrum.
- **Instrumentation artifacts**: Baseline shifts or noise can affect measurements.
- **Indirect transitions**: Smoother, less steep edges compared to direct transitions.
---
## **Summary Table**
| Plot Type | Y-Axis | X-Axis | Band Gap Estimate |
|-----------------|----------------------------|----------|------------------|
| Direct (allowed)| \((A \cdot h\nu)^2\) | \(h\nu\) | ~3.1–3.3 eV |
| Indirect | \((A \cdot h\nu)^{1/2}\) | \(h\nu\) | (Find from plot) |
---
**Plotting these values in Excel or a plotting tool will help visualize and better estimate the exact band gap values.**
📢 Instructions:
- Ask anything relatd to above question only.
- For new Question goto :